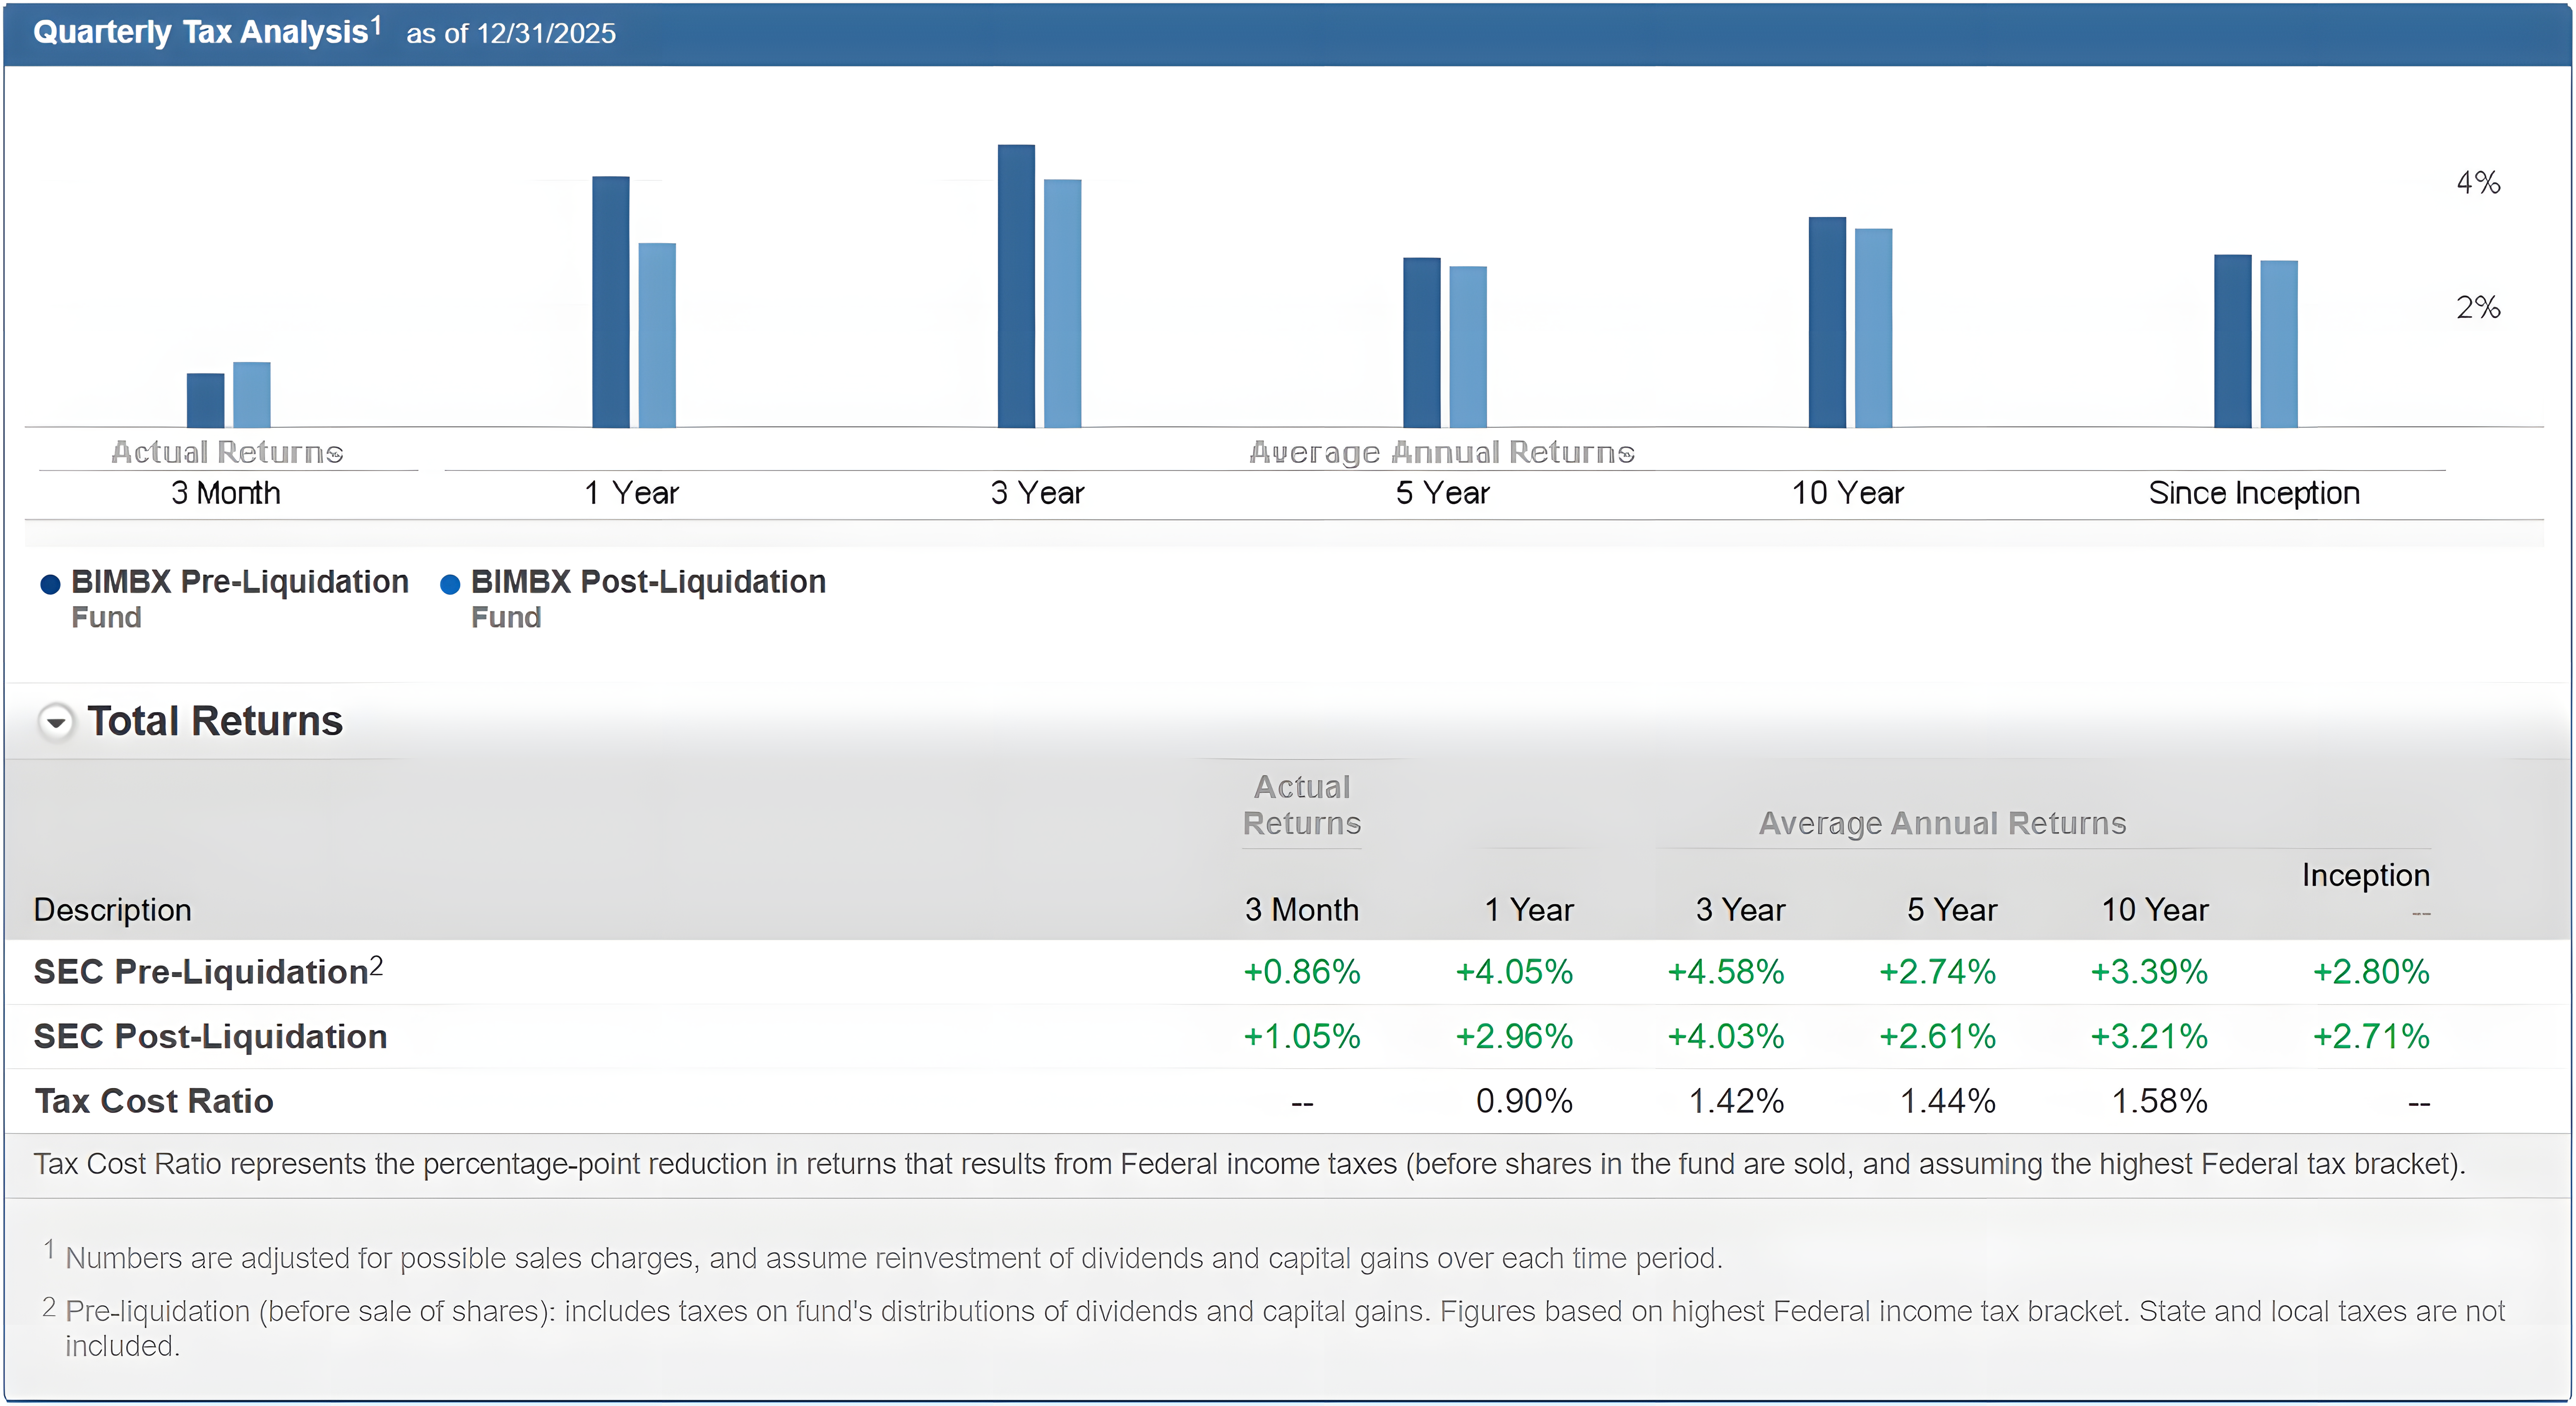
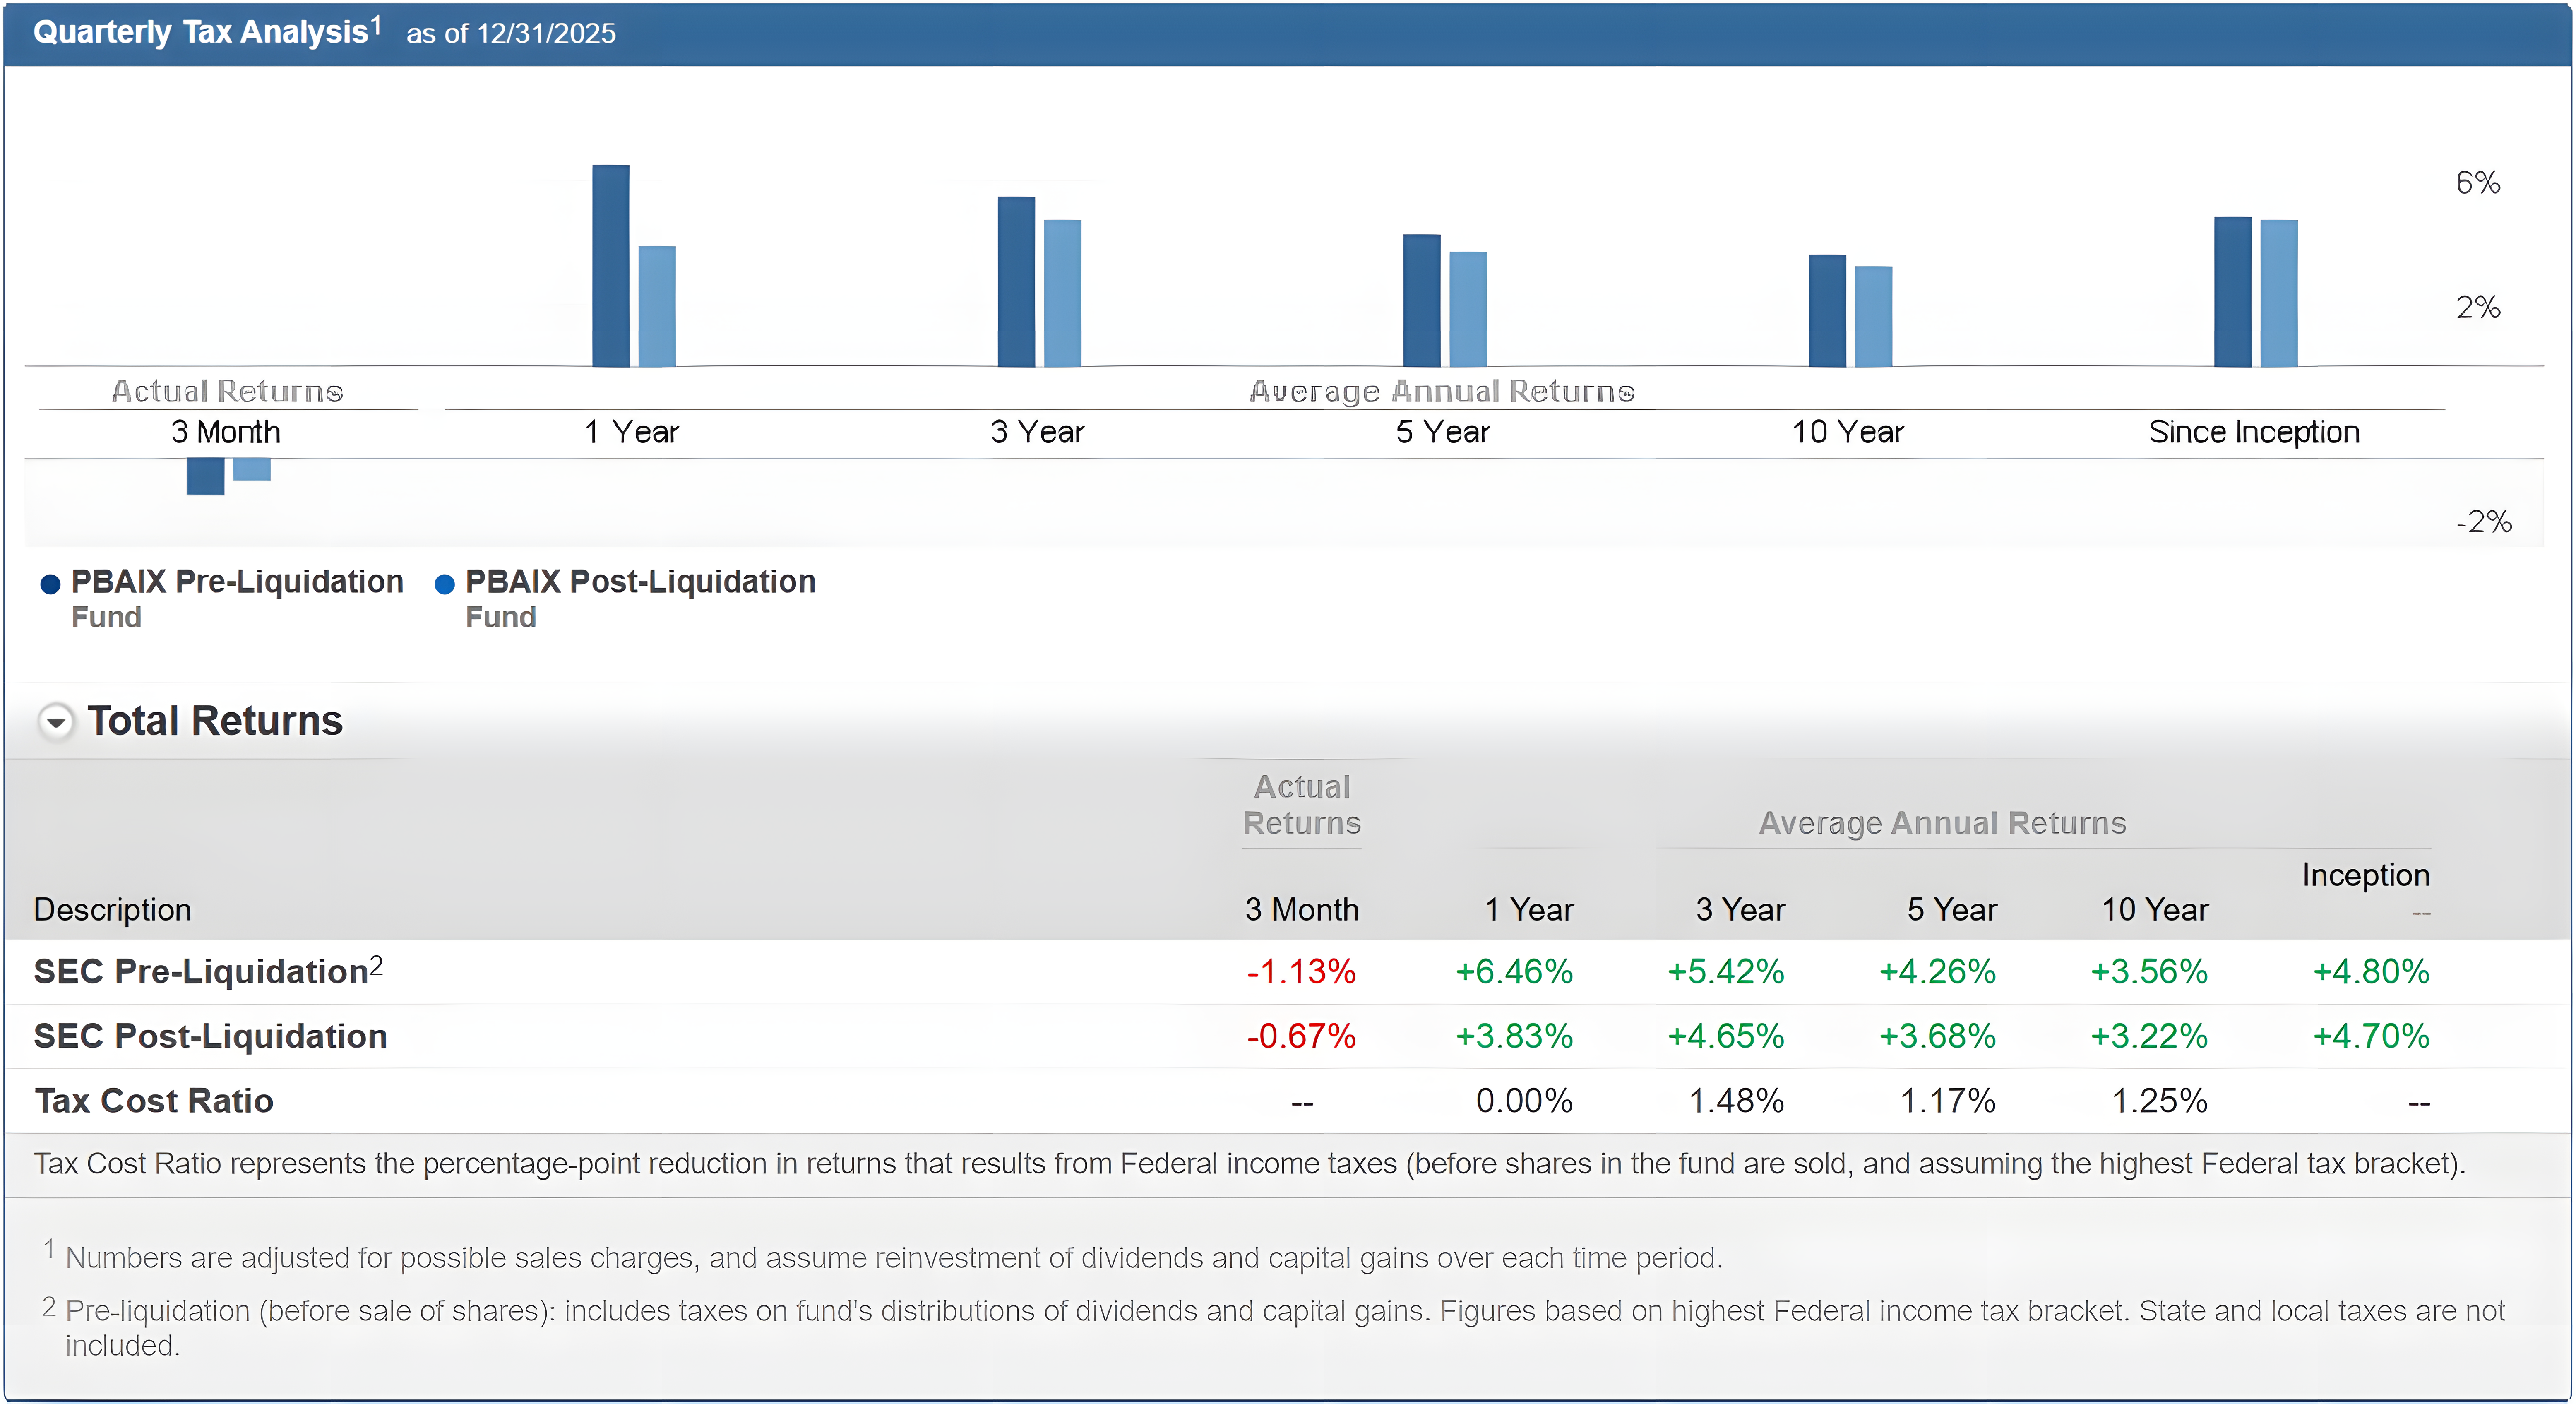
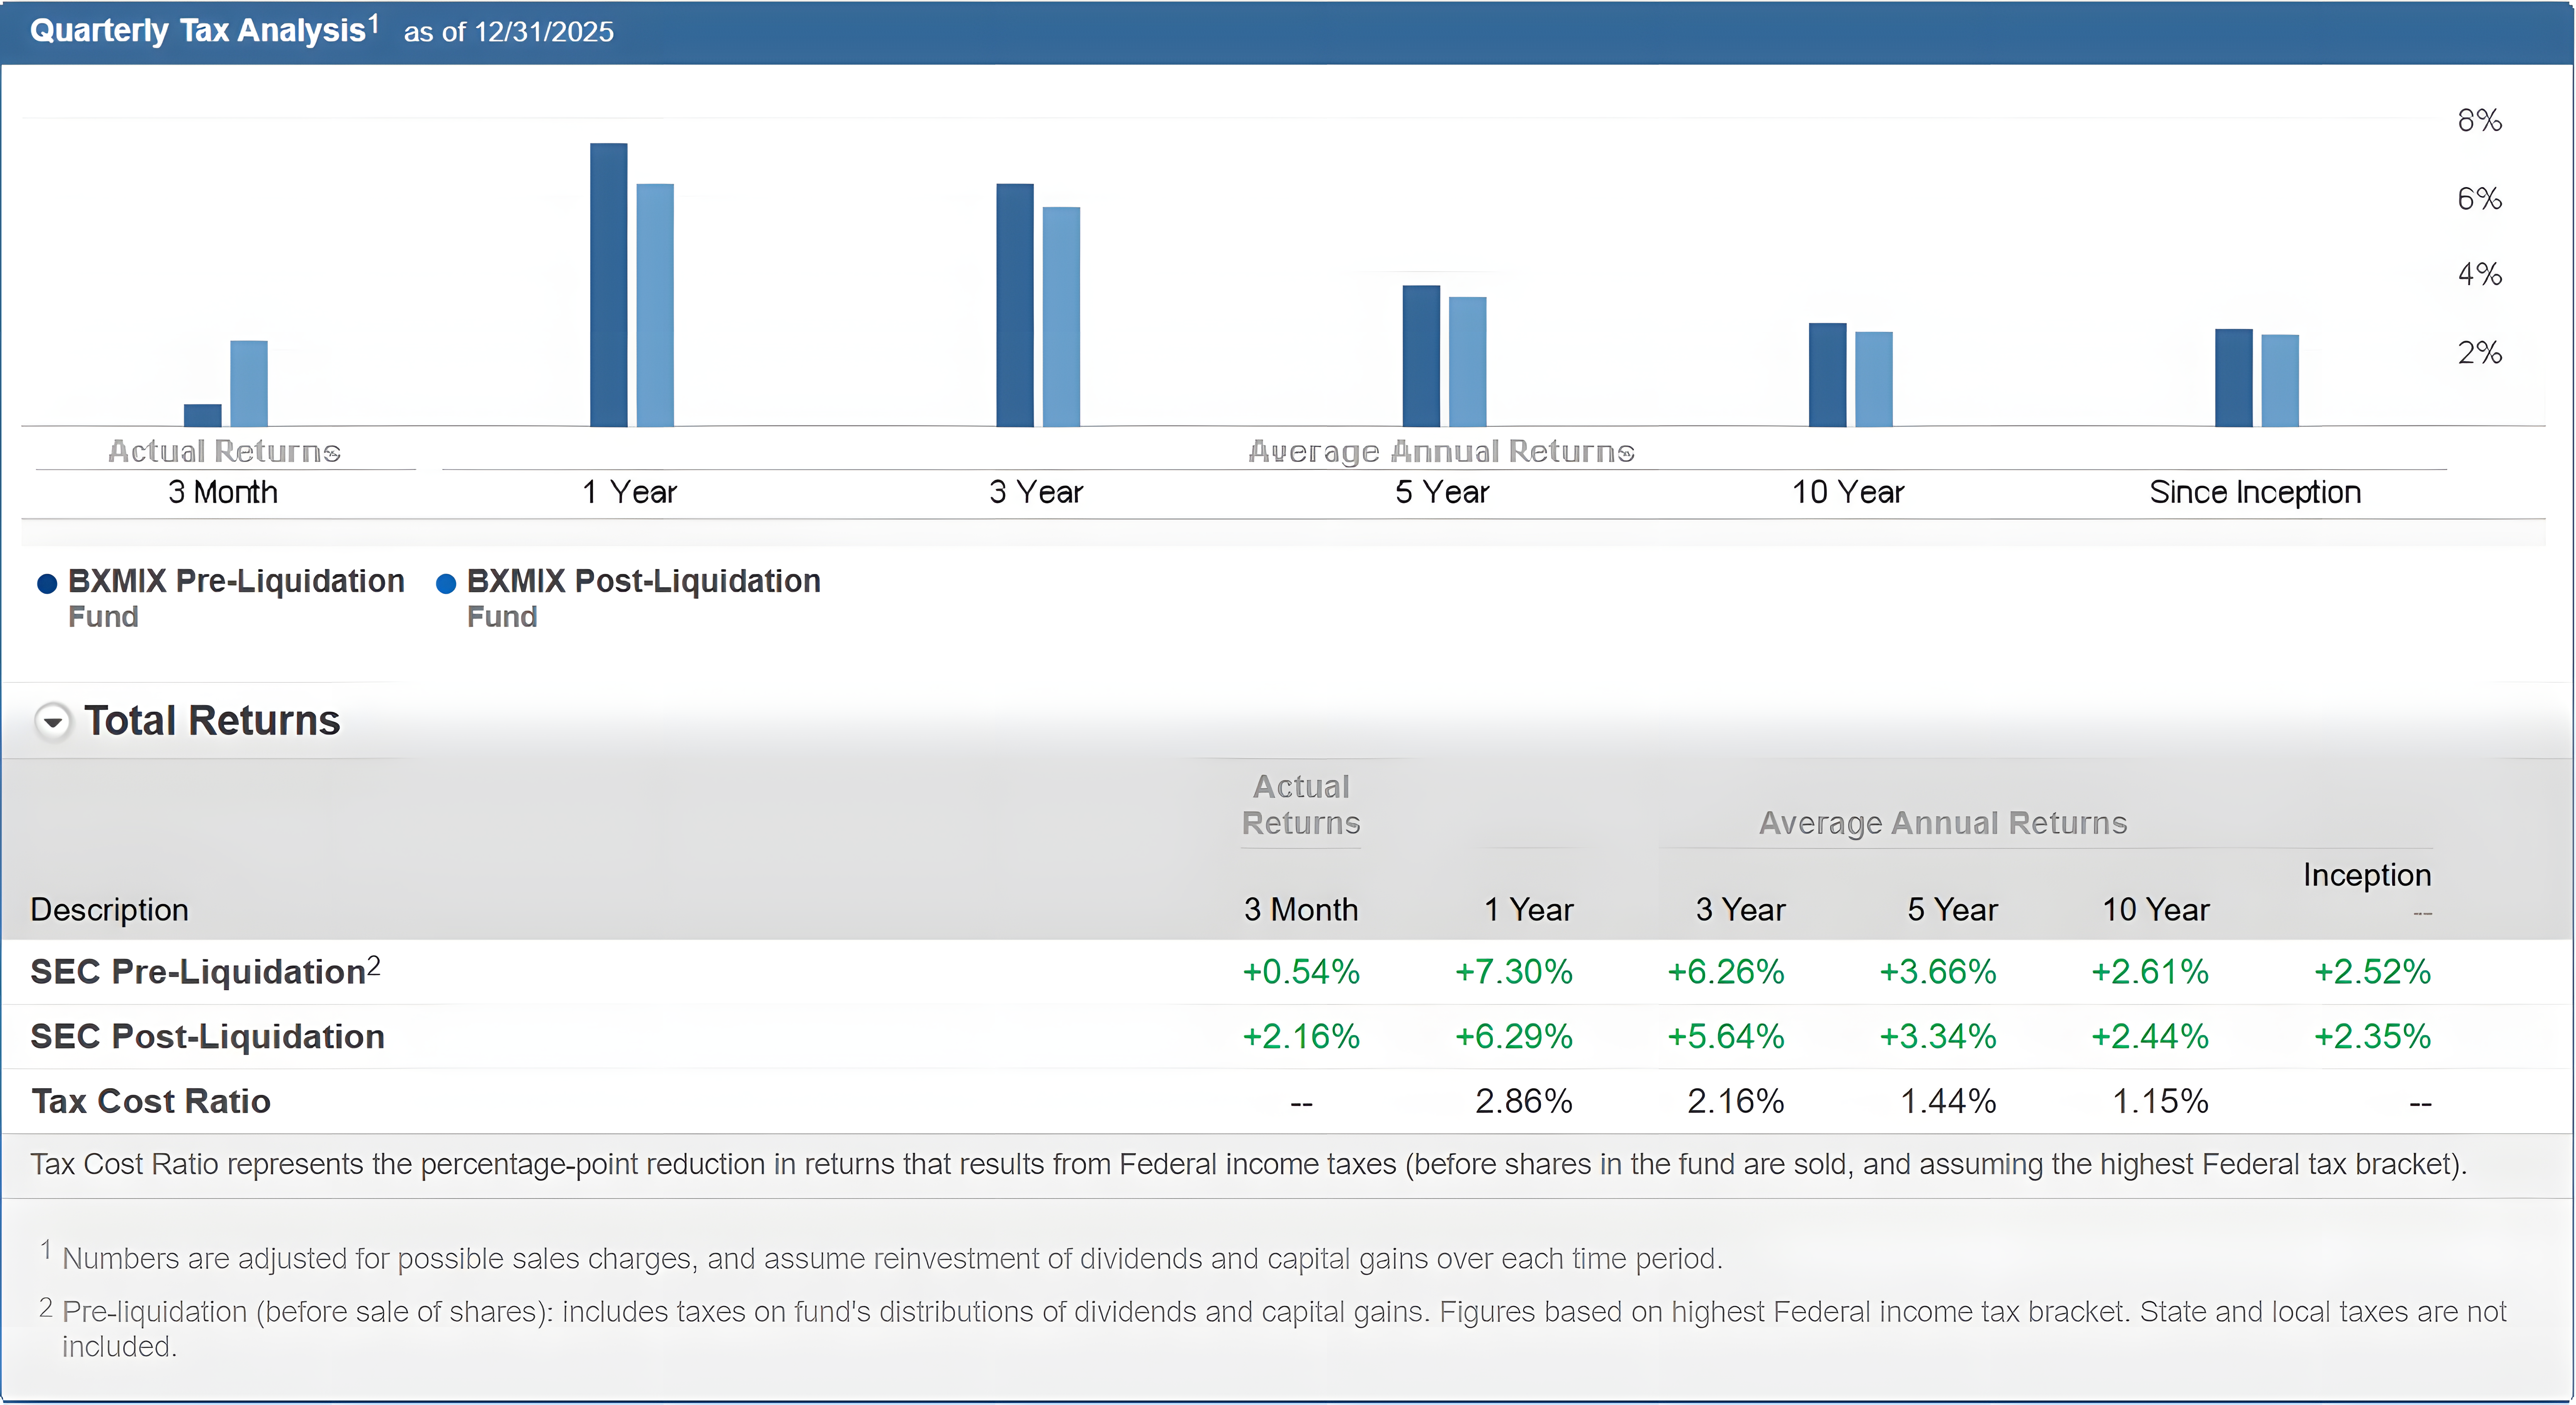
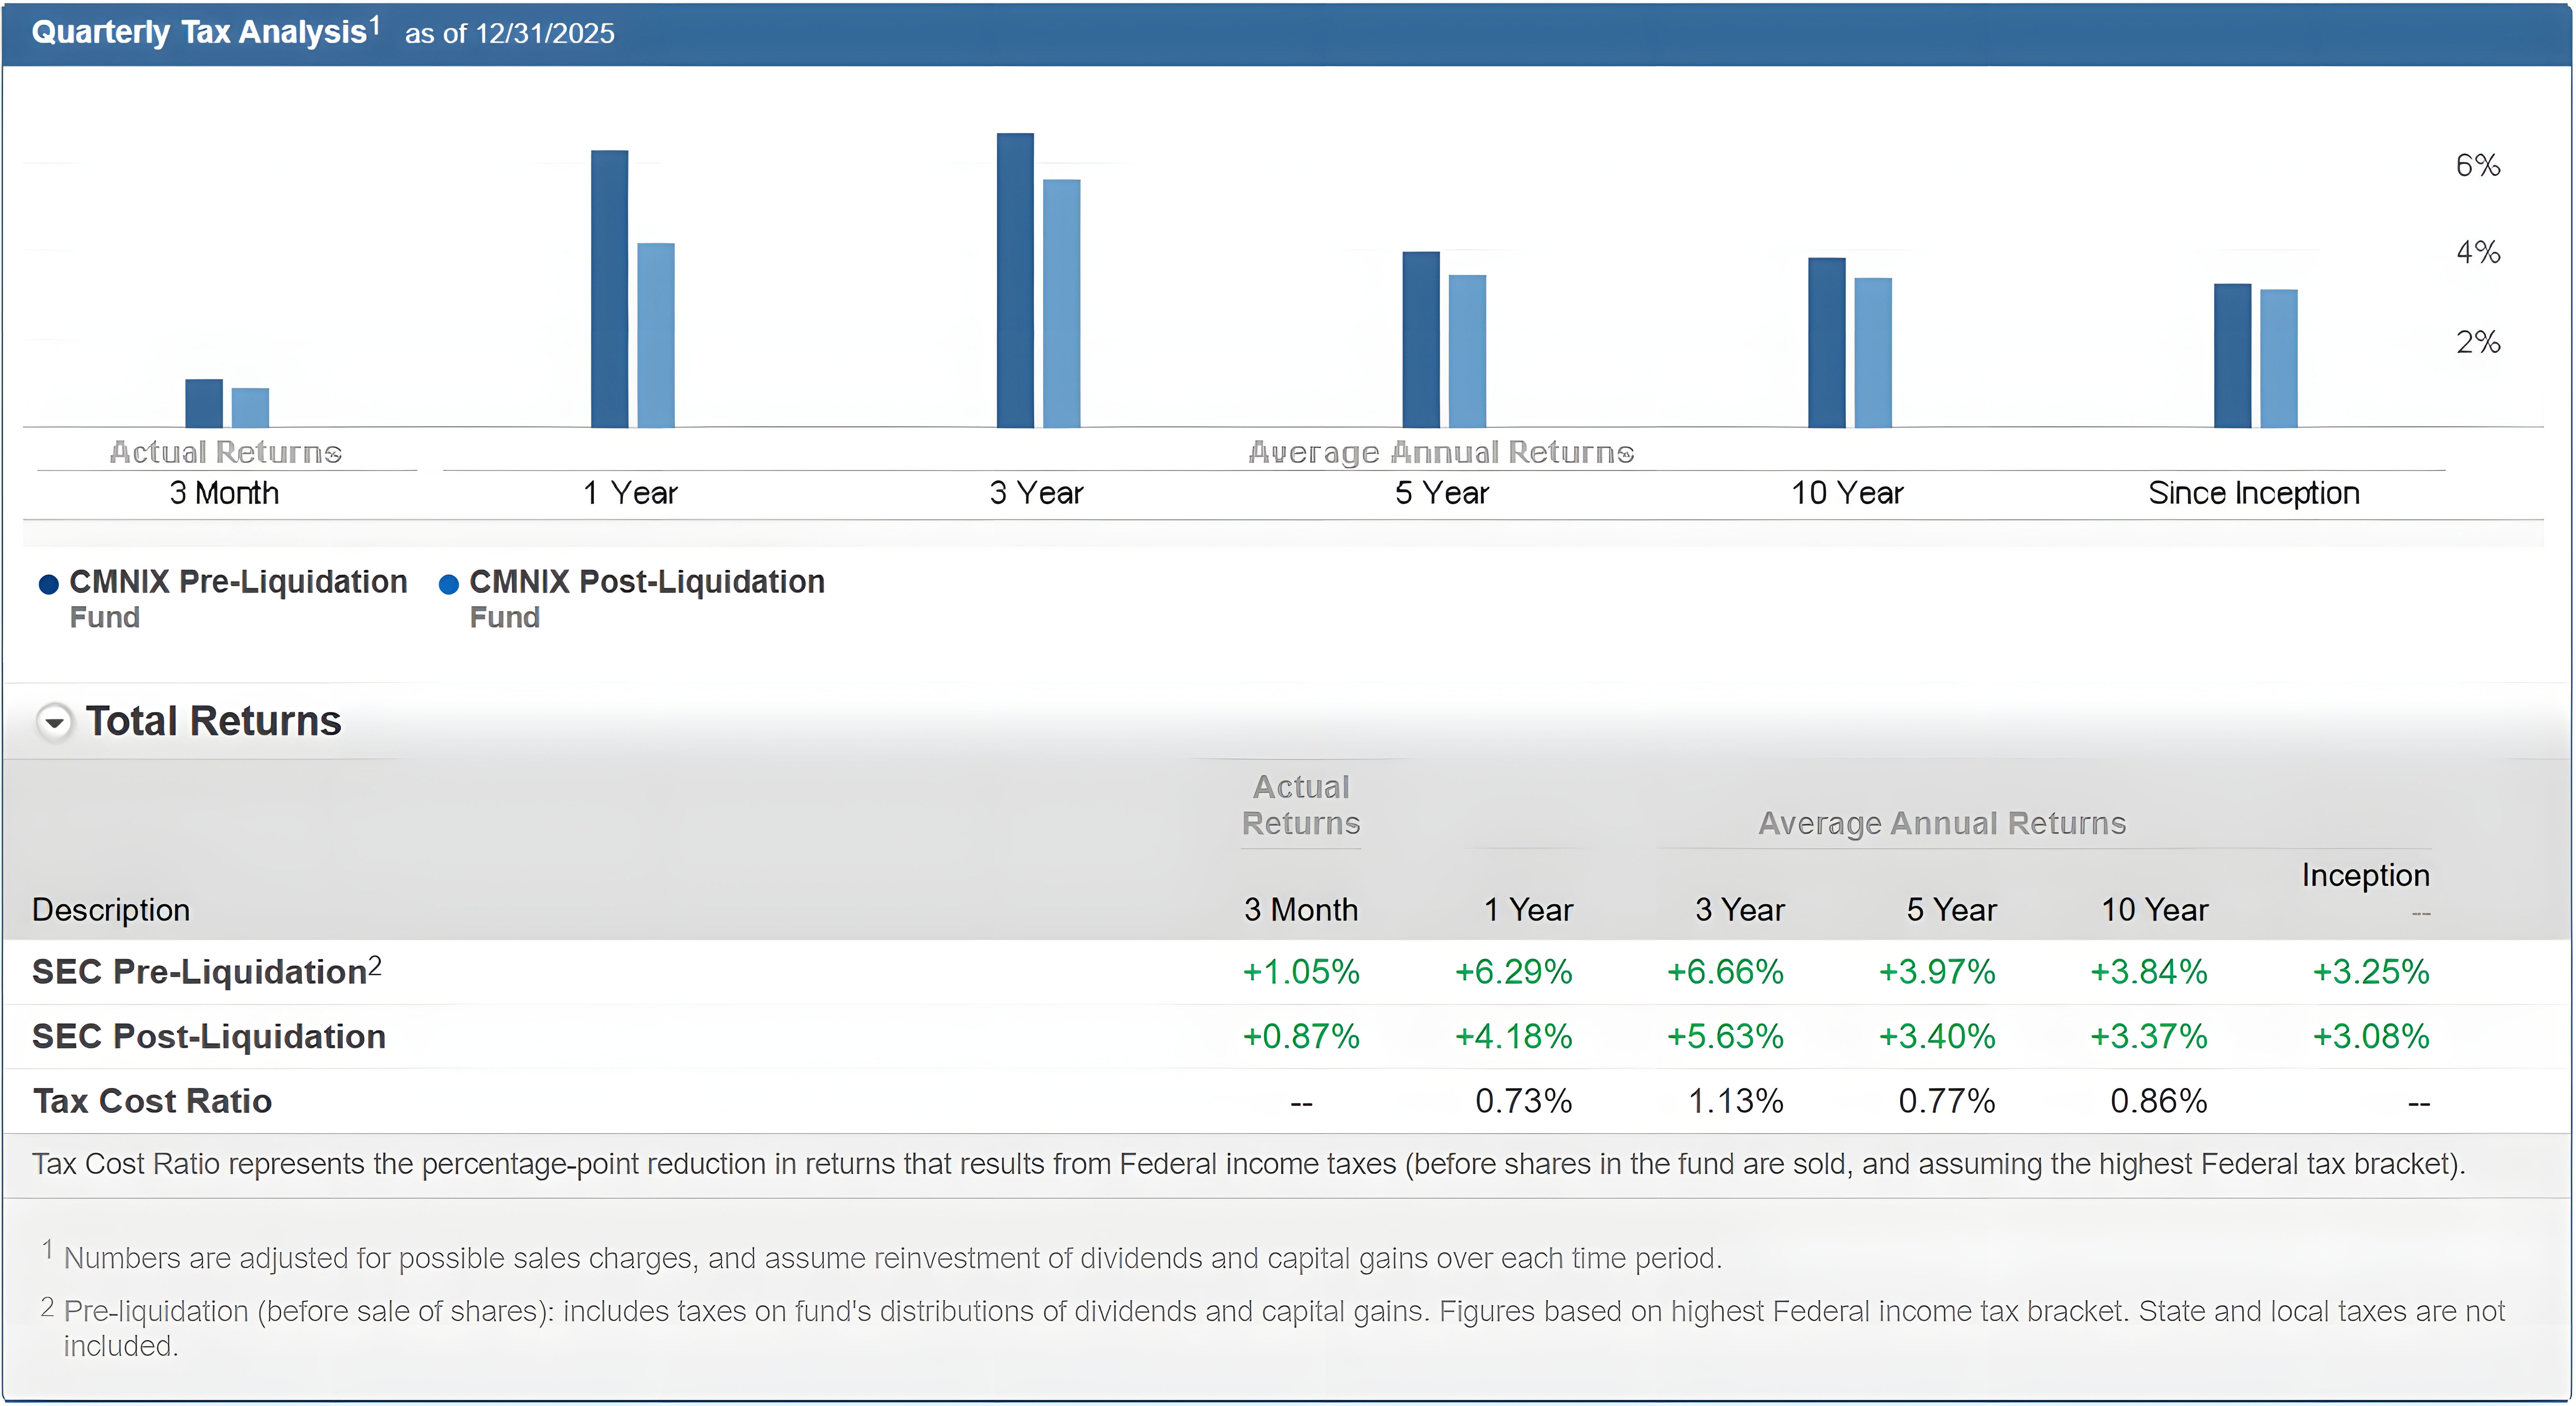
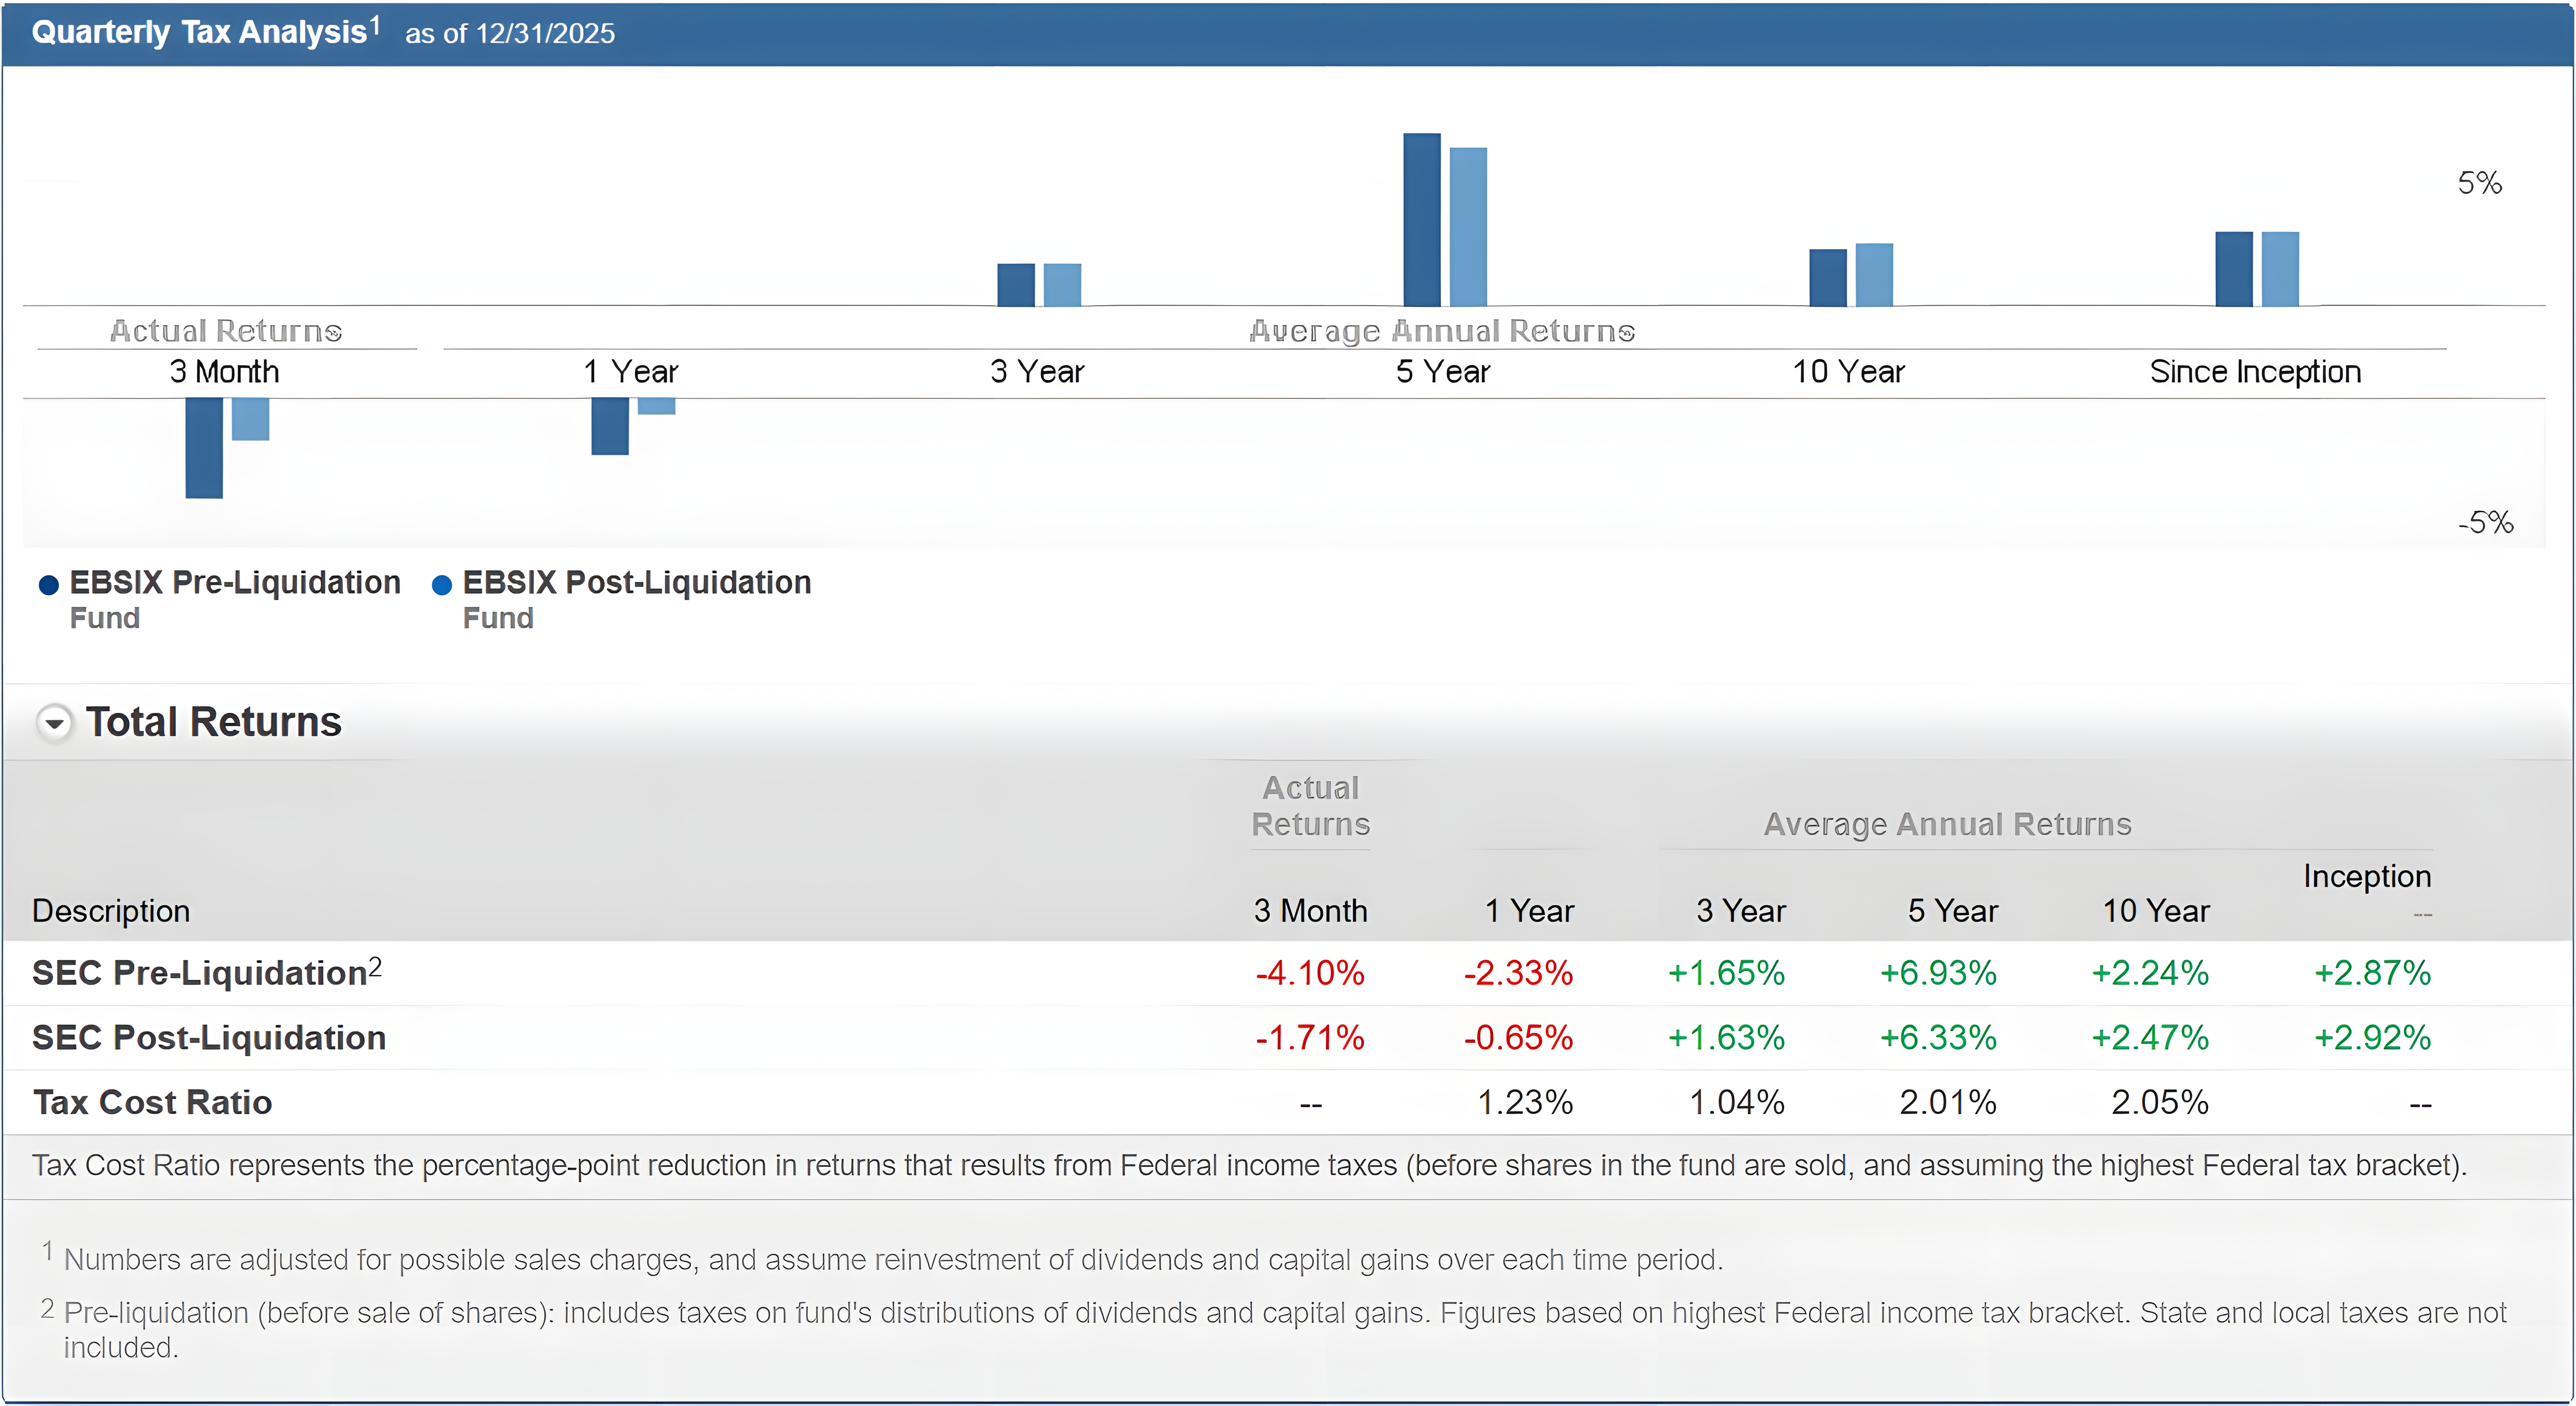
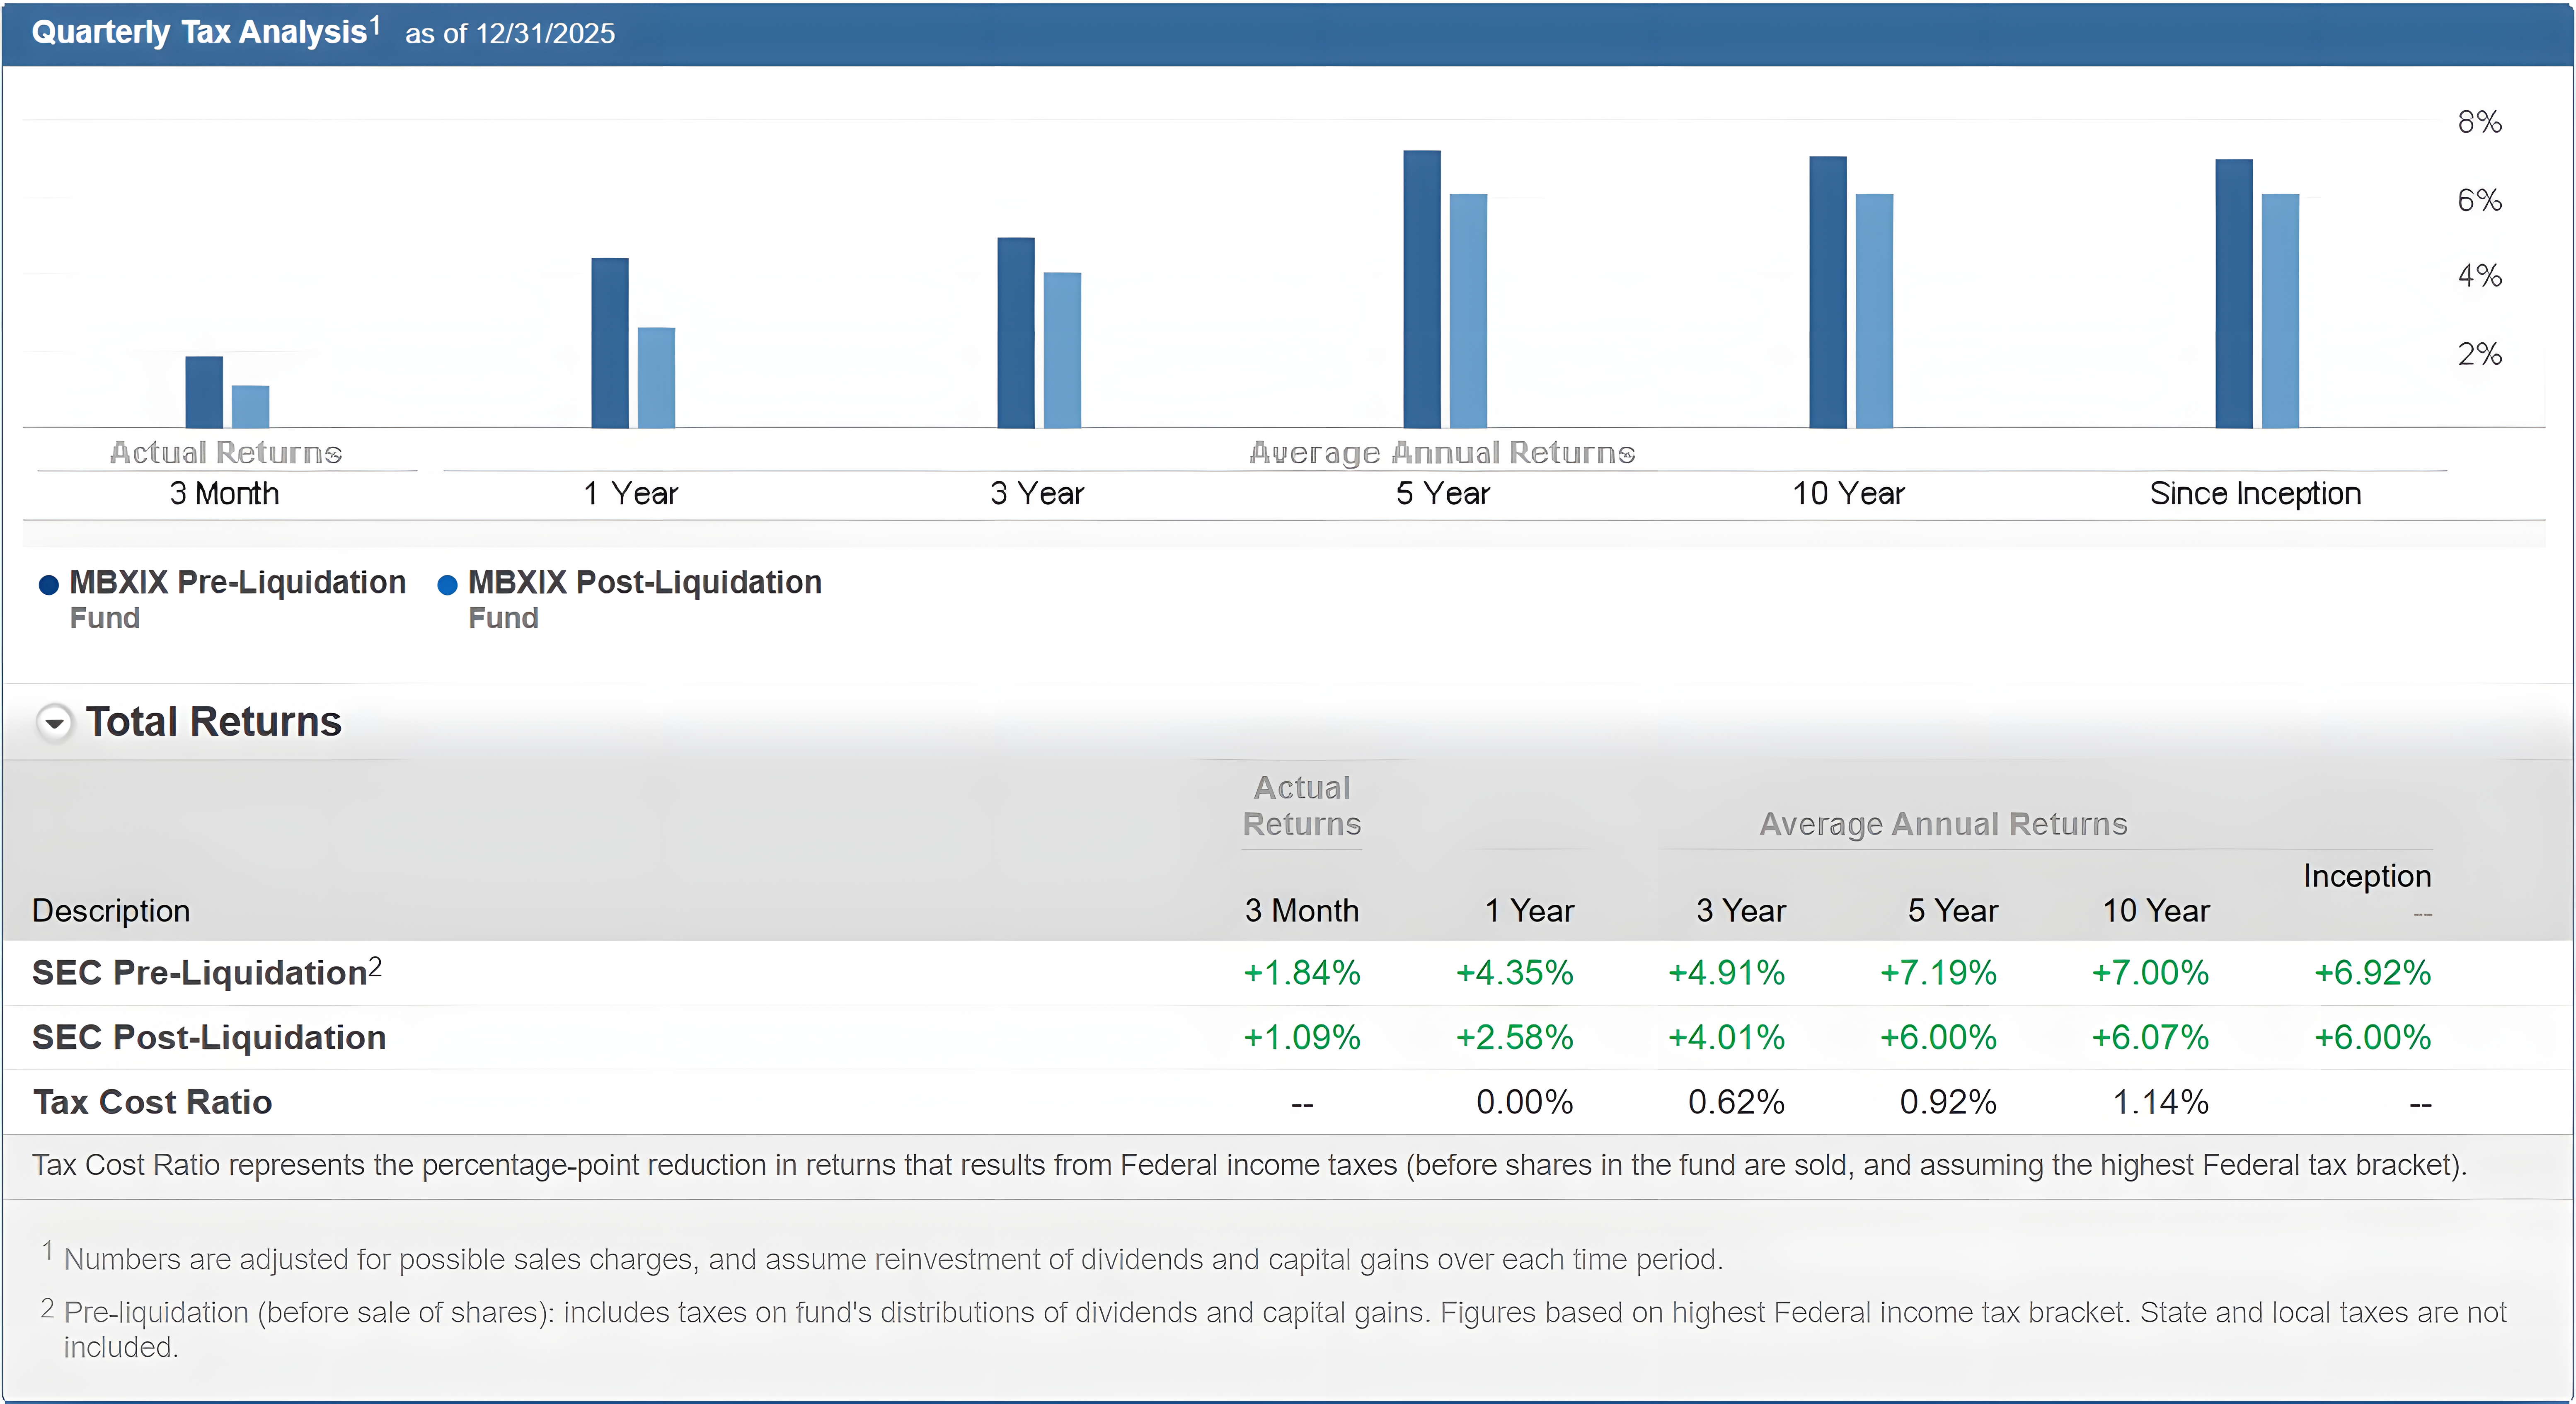
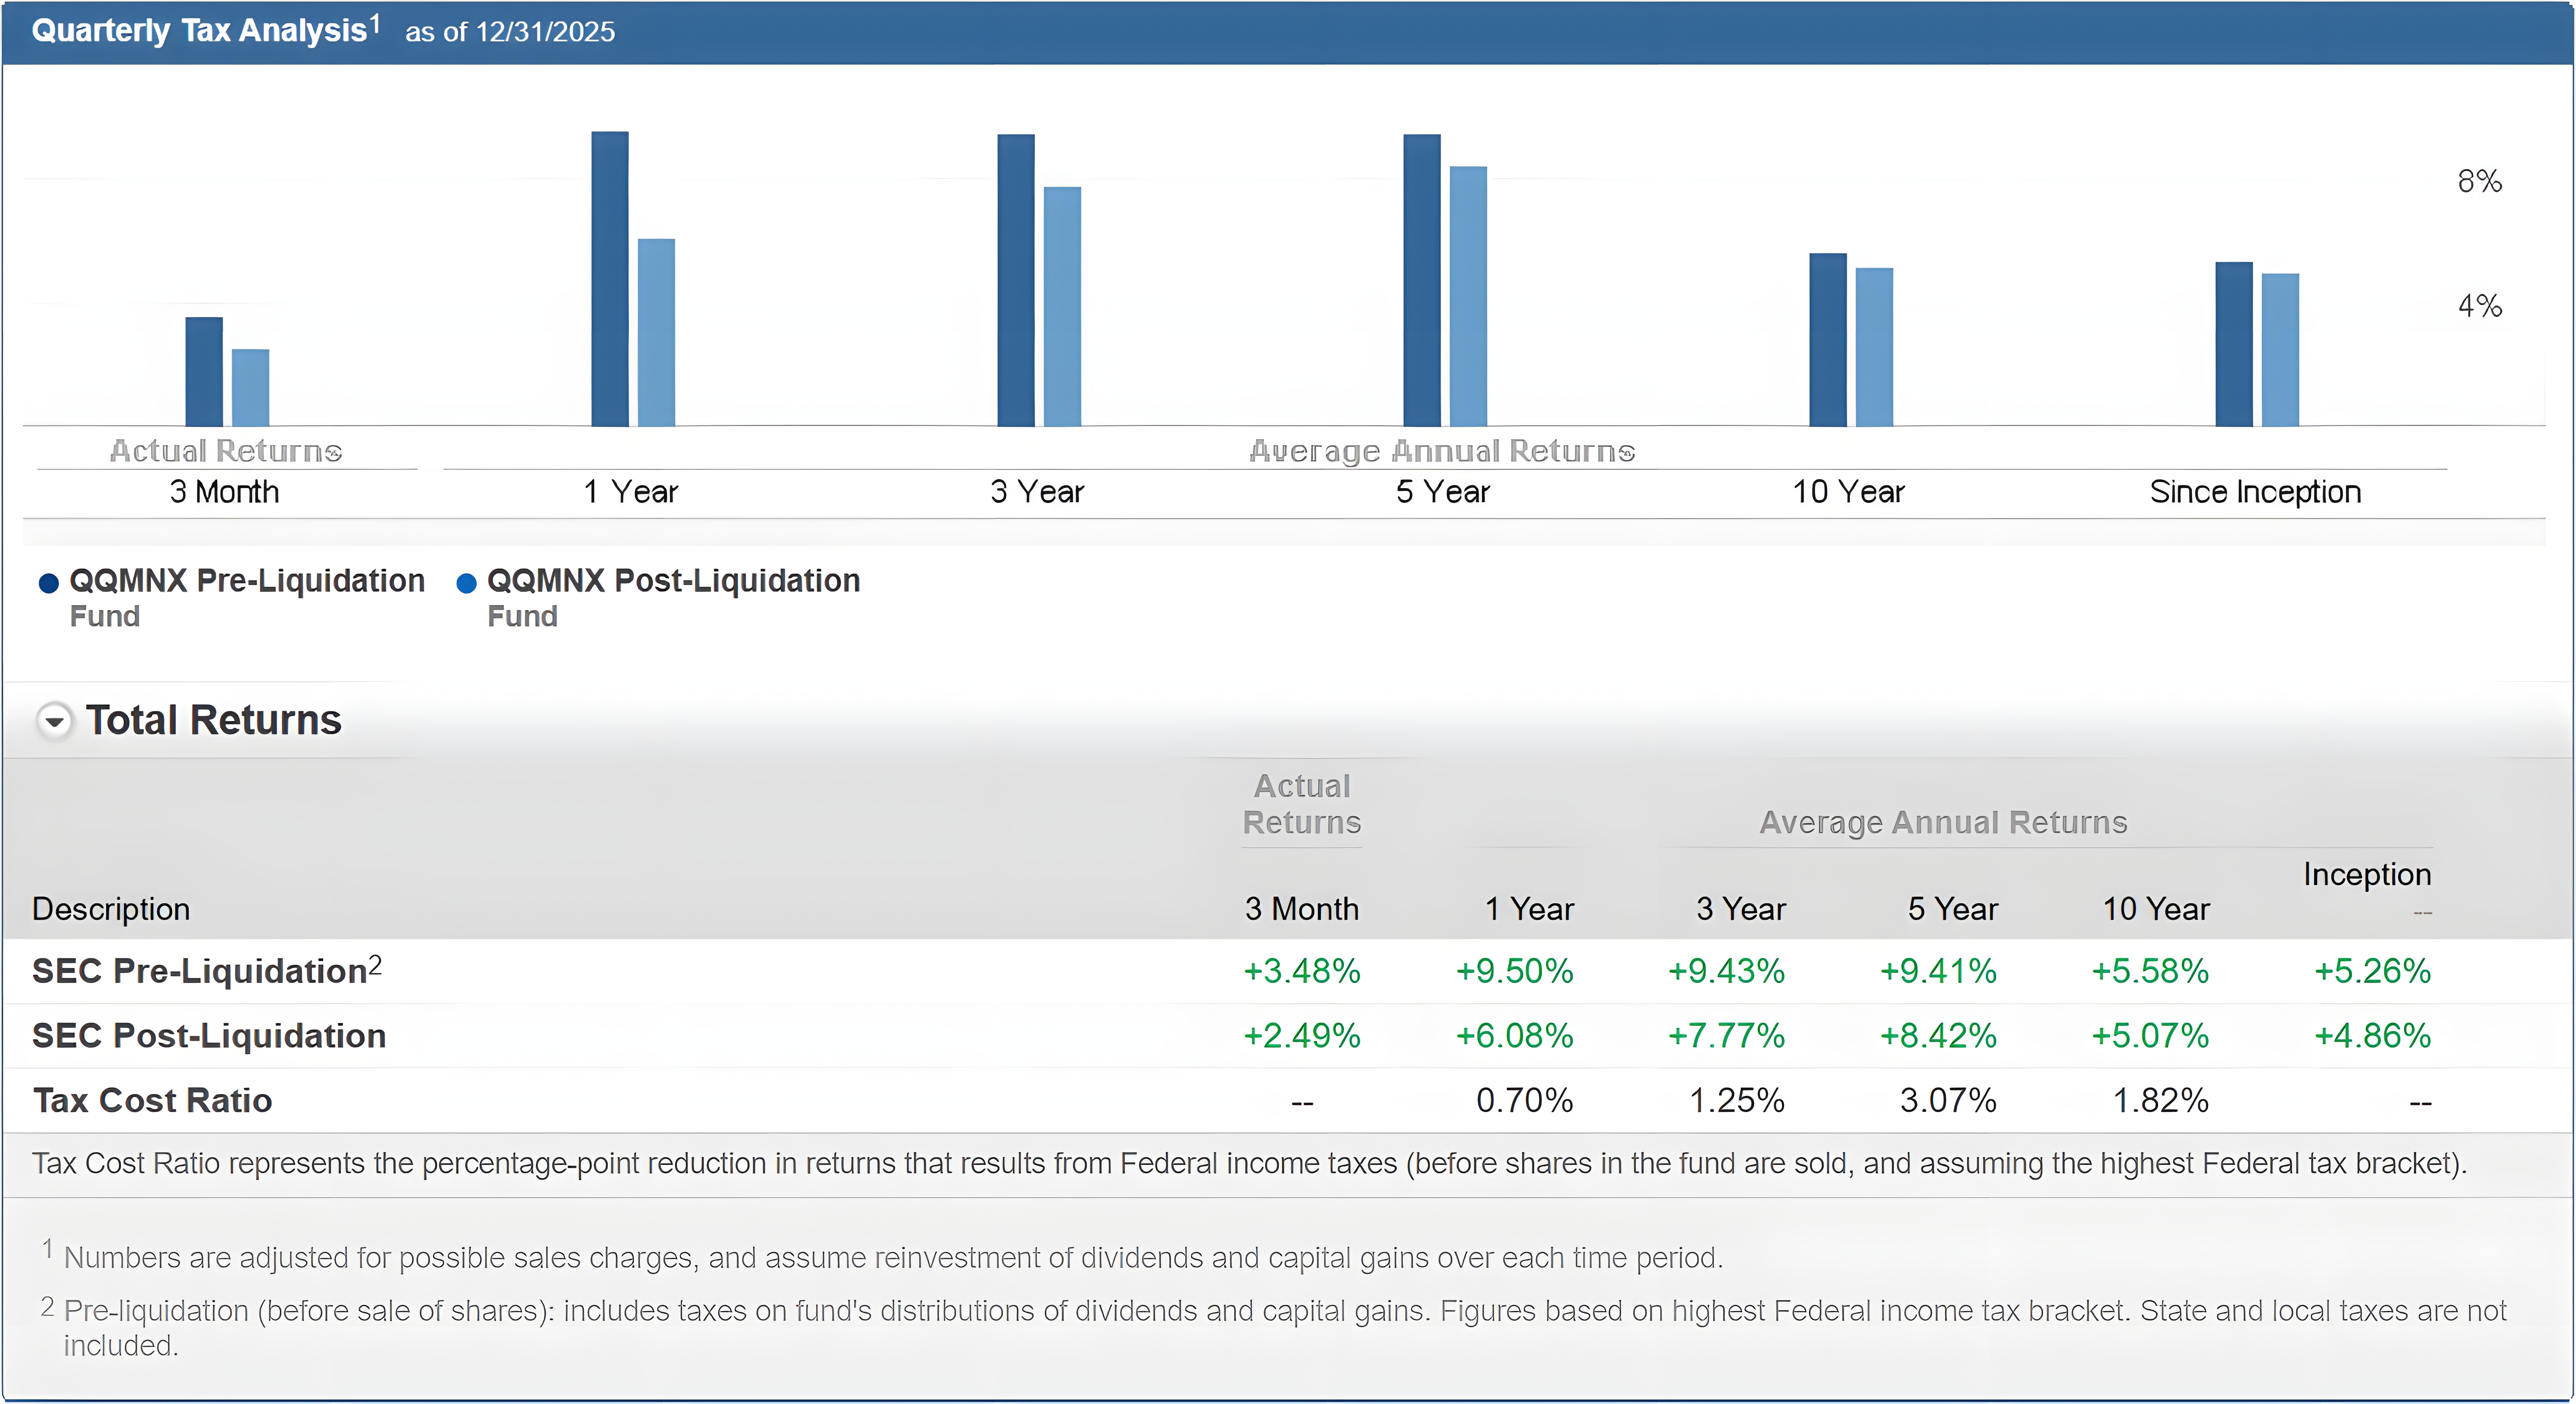
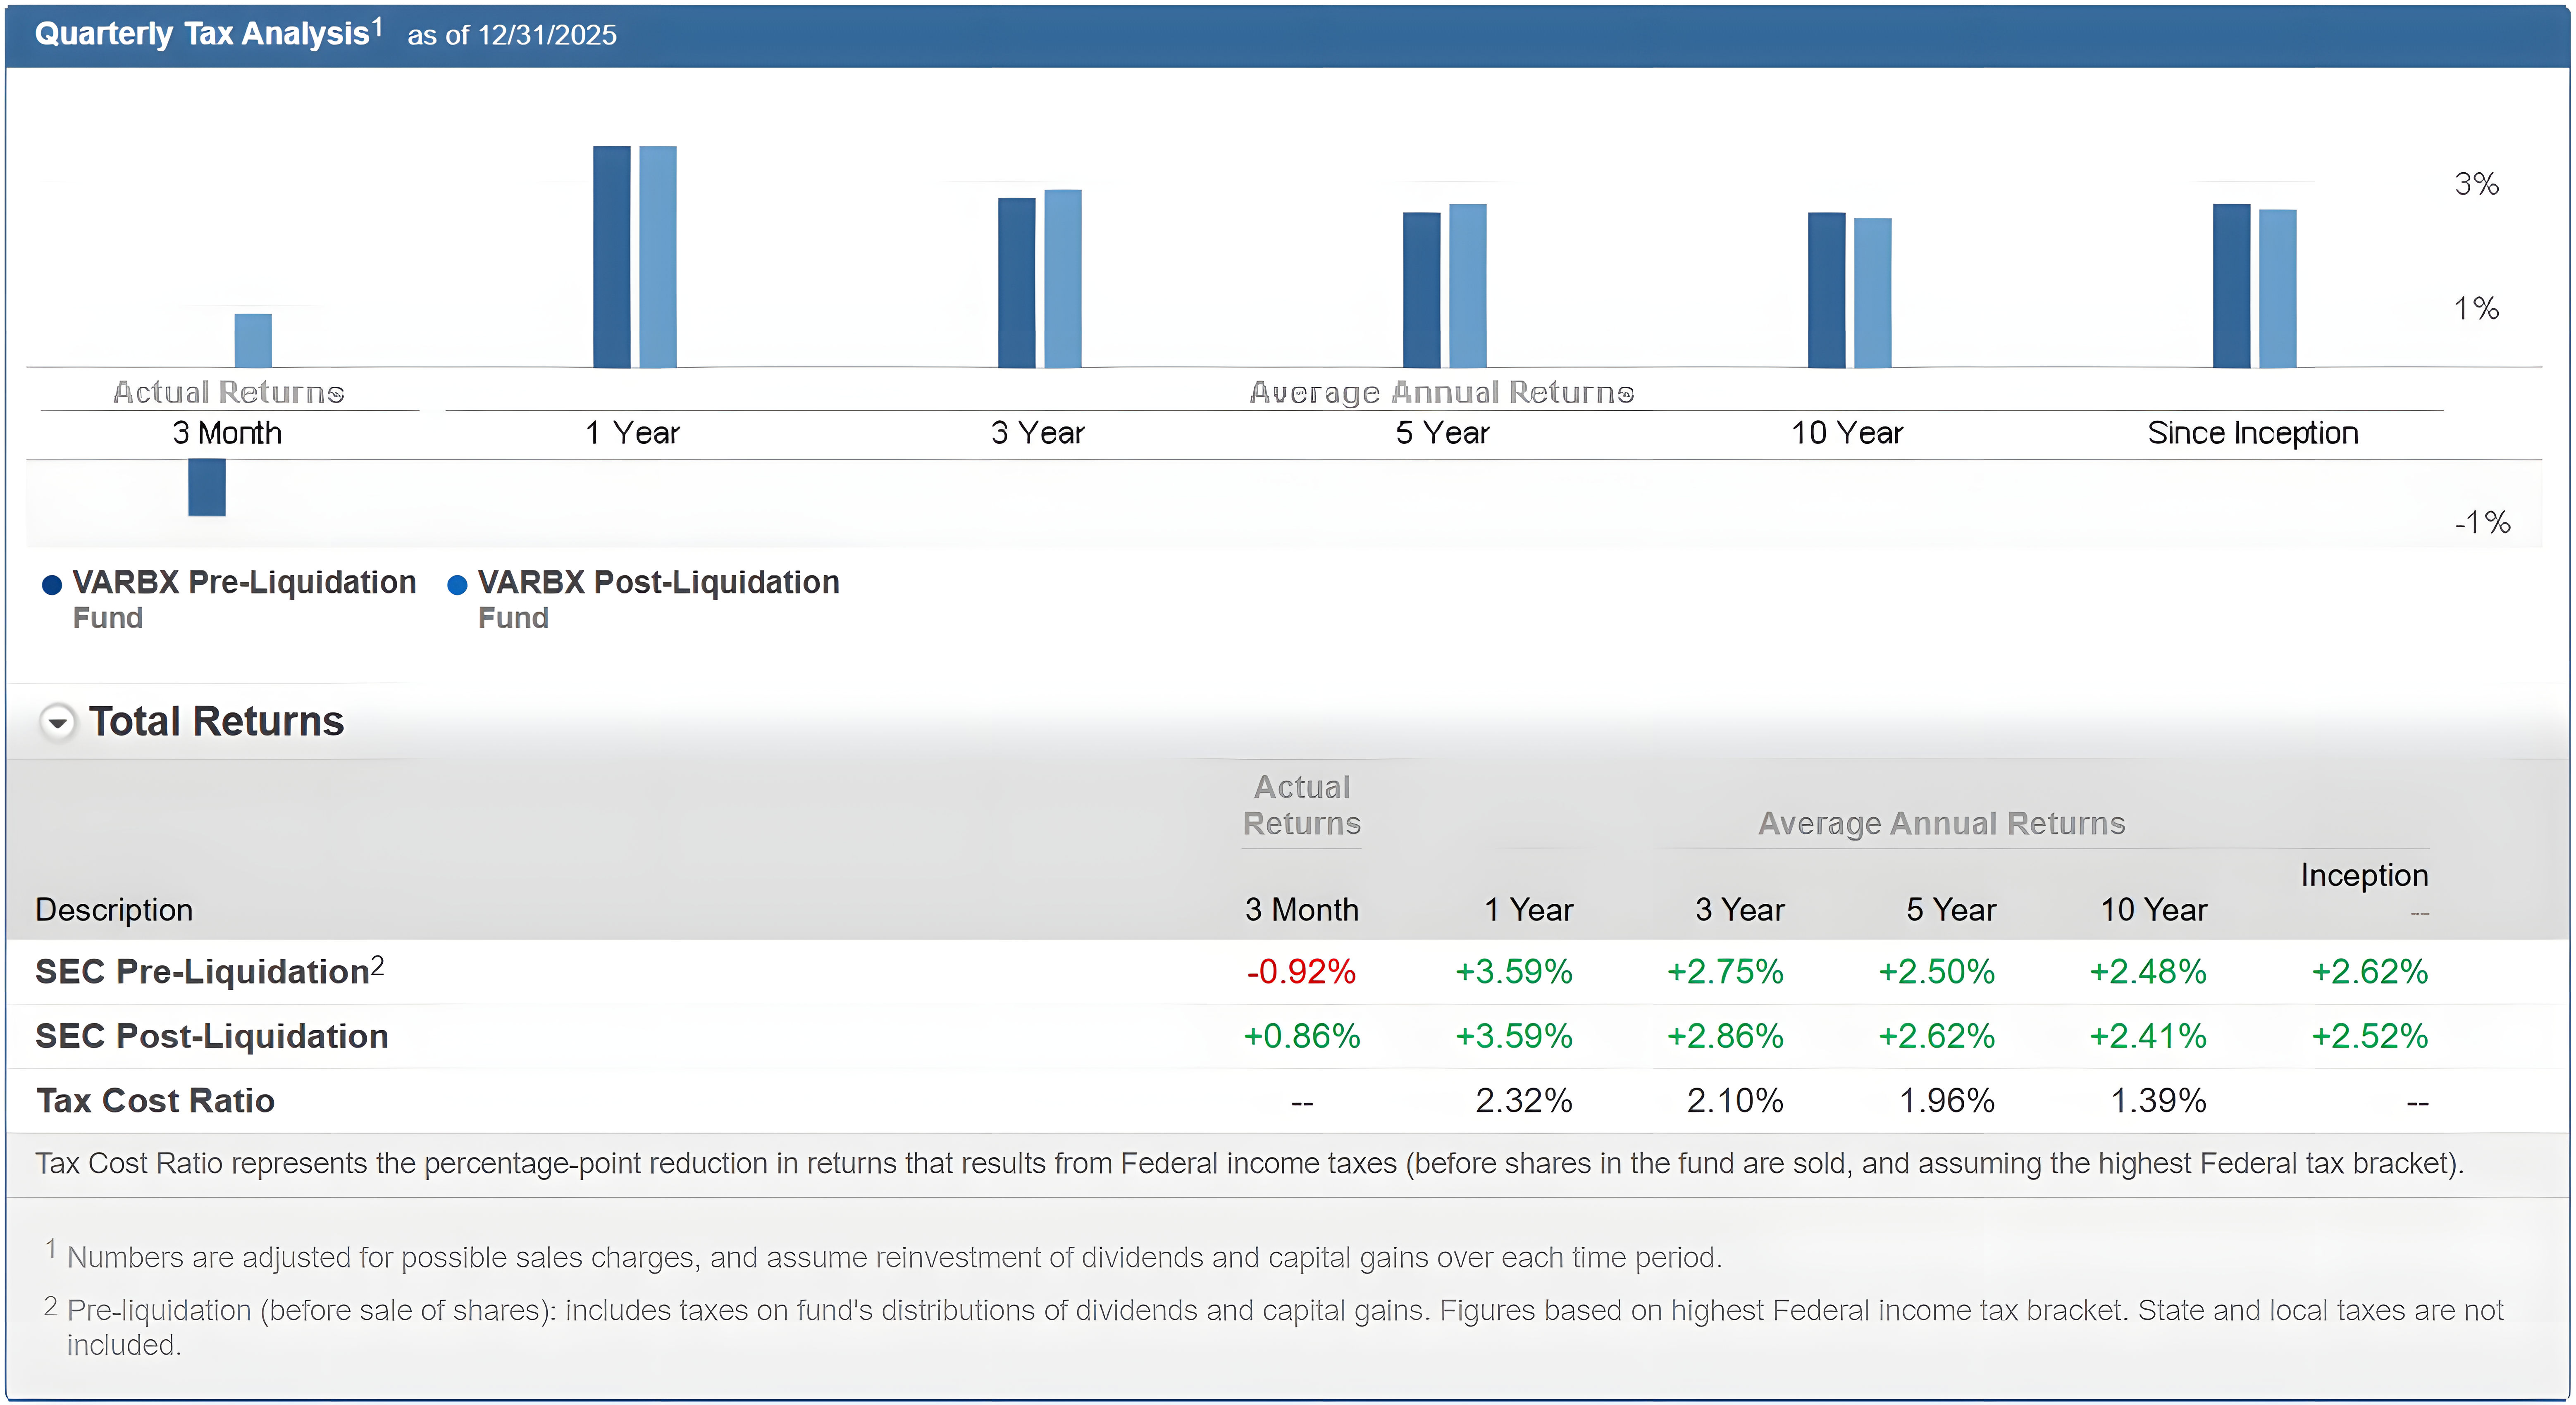
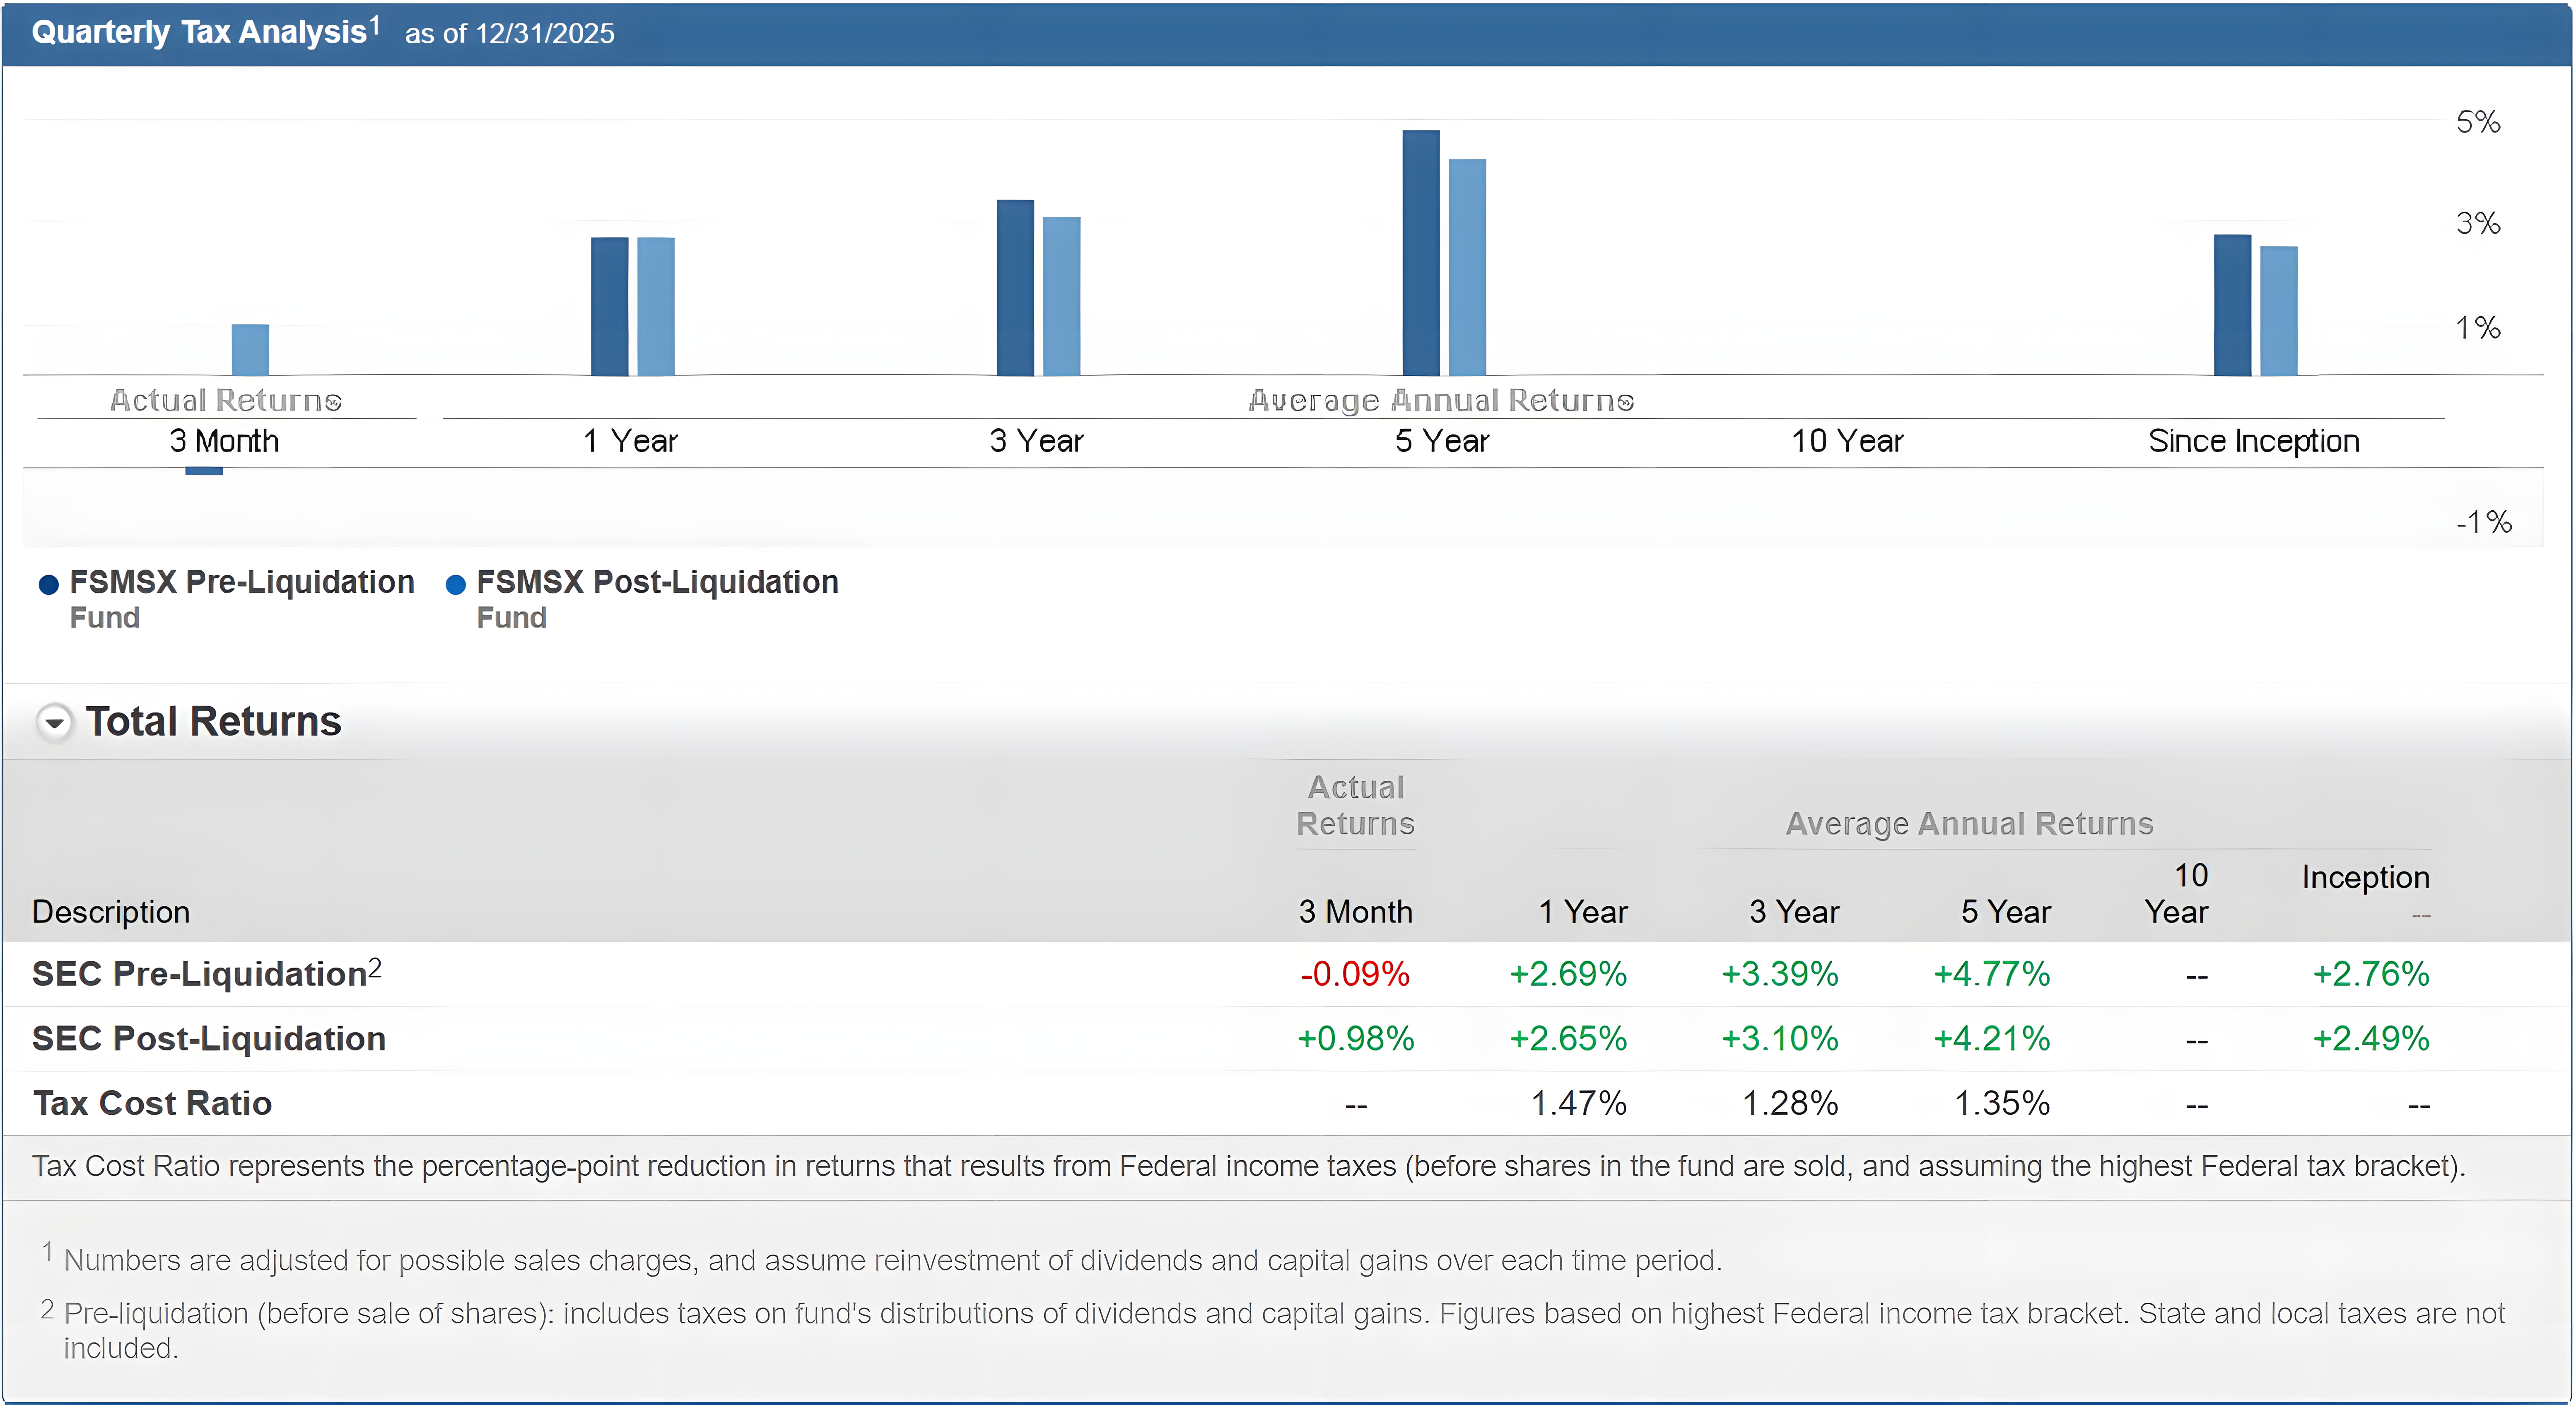
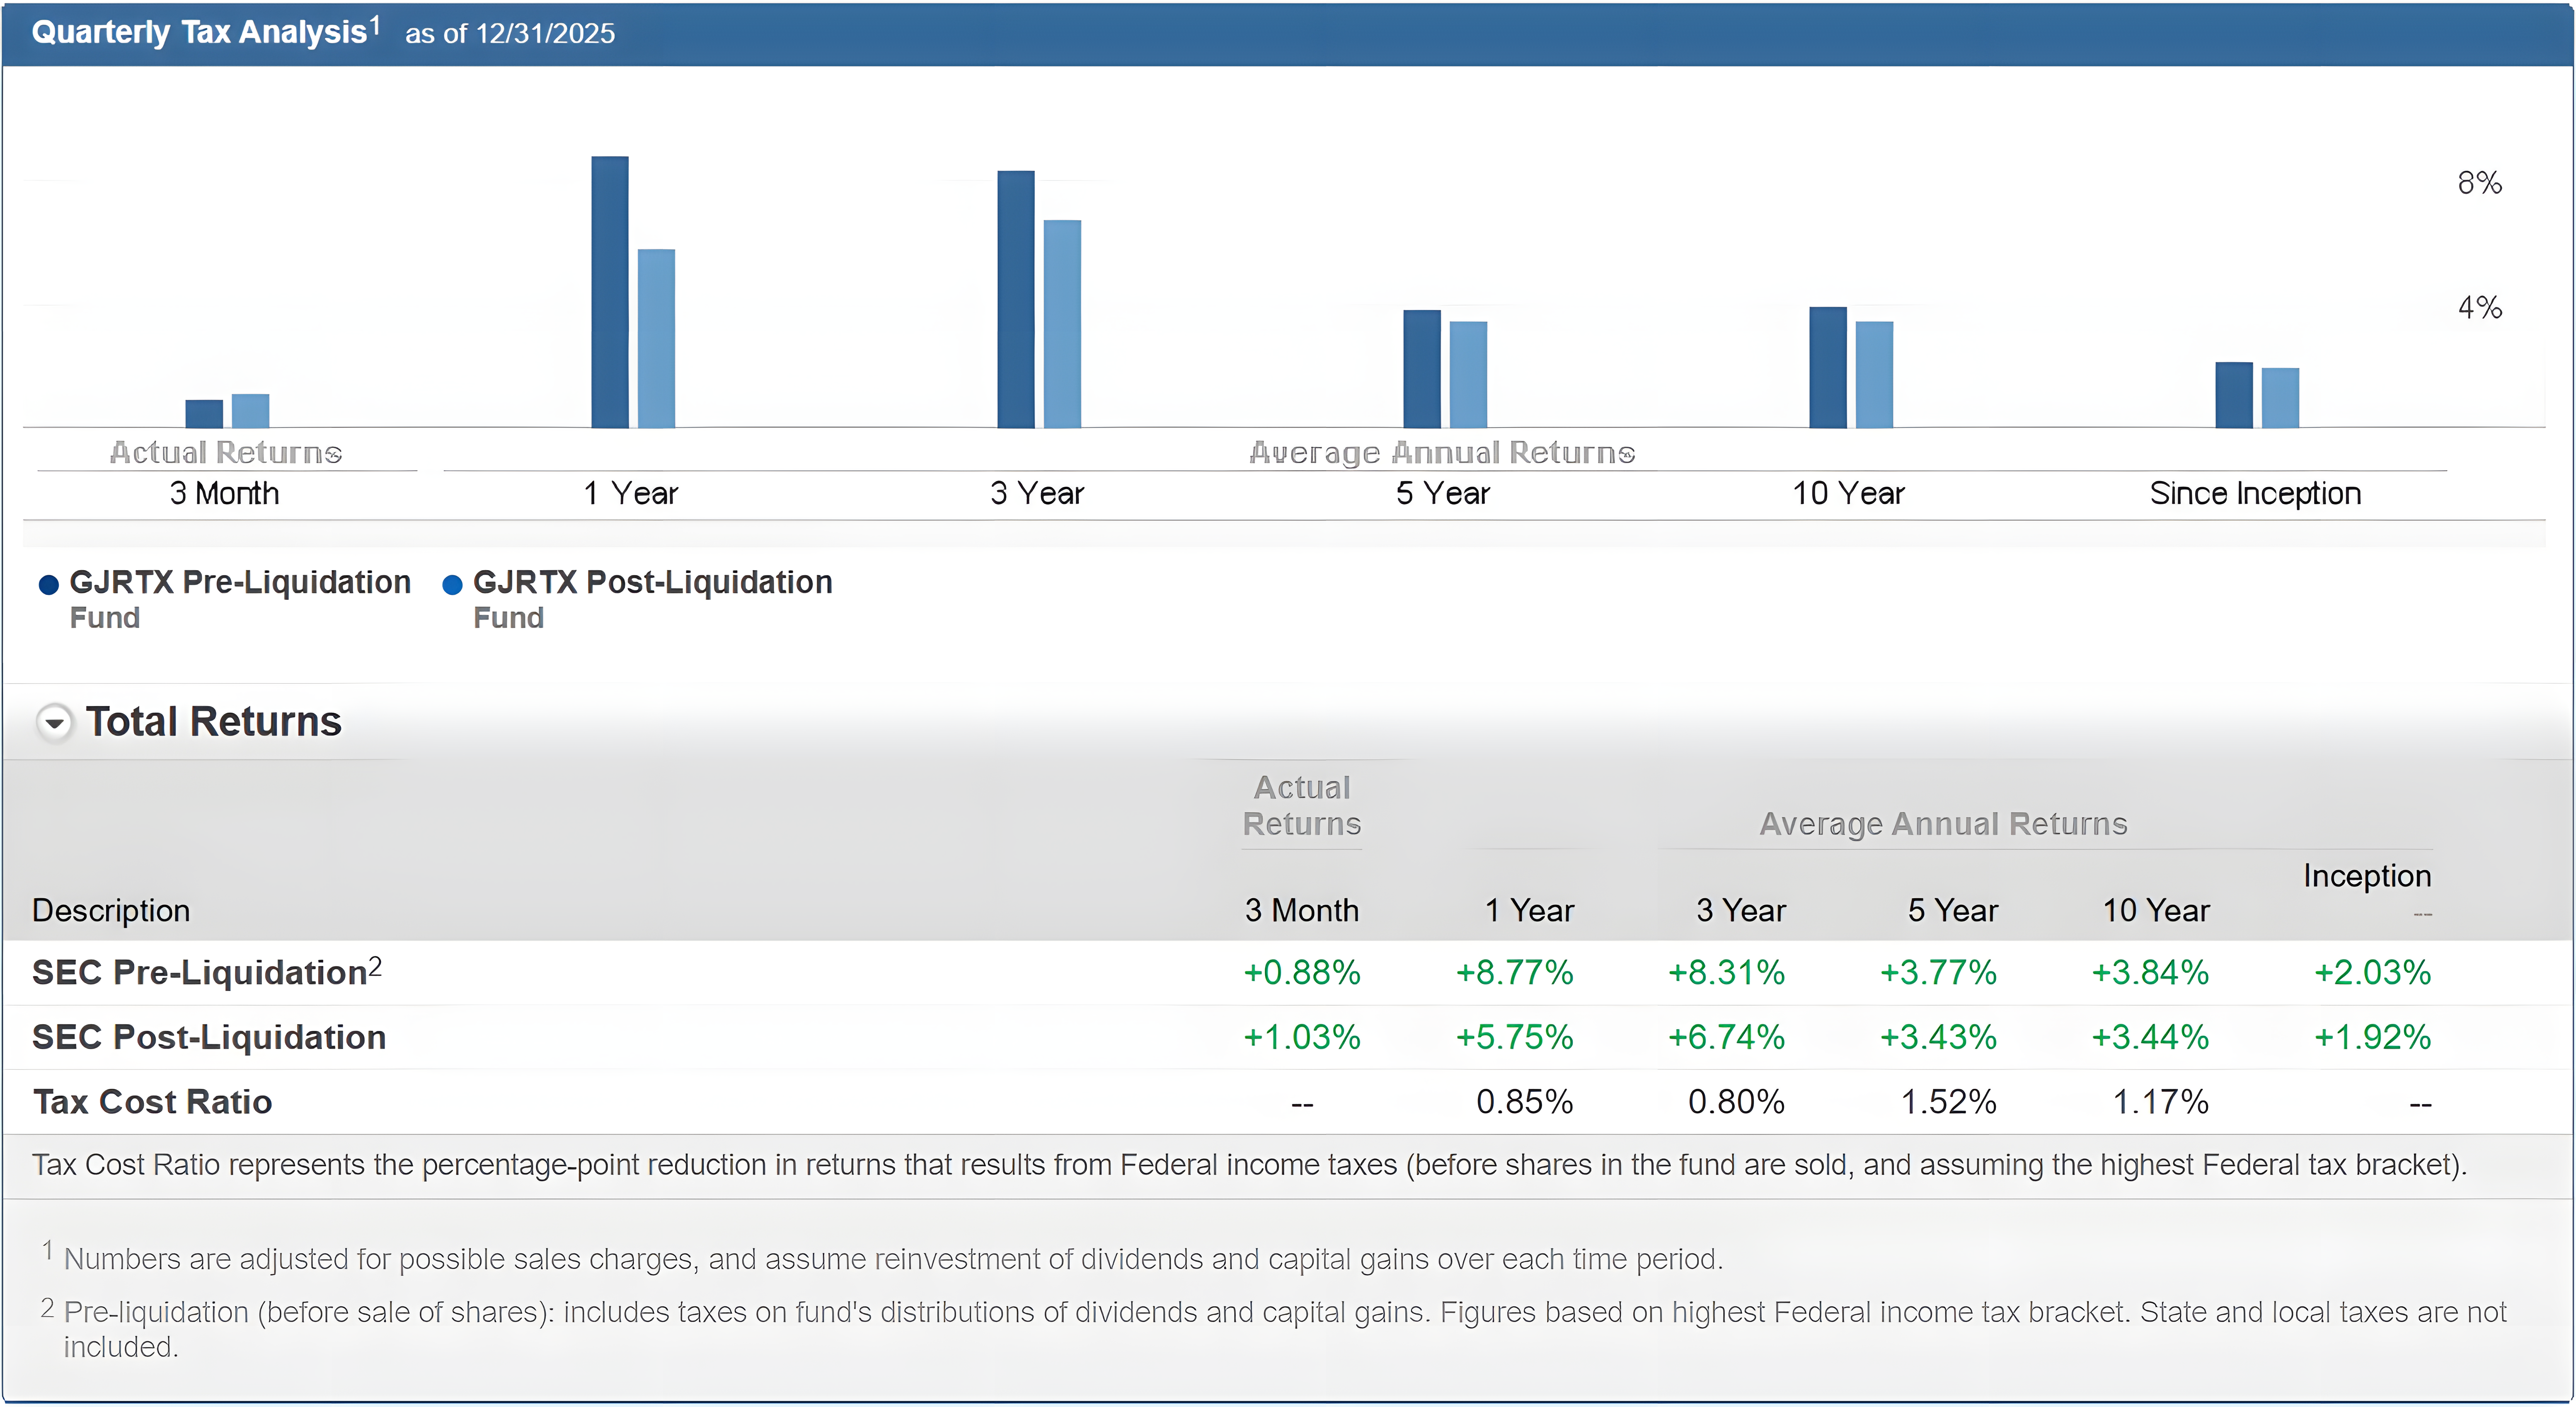
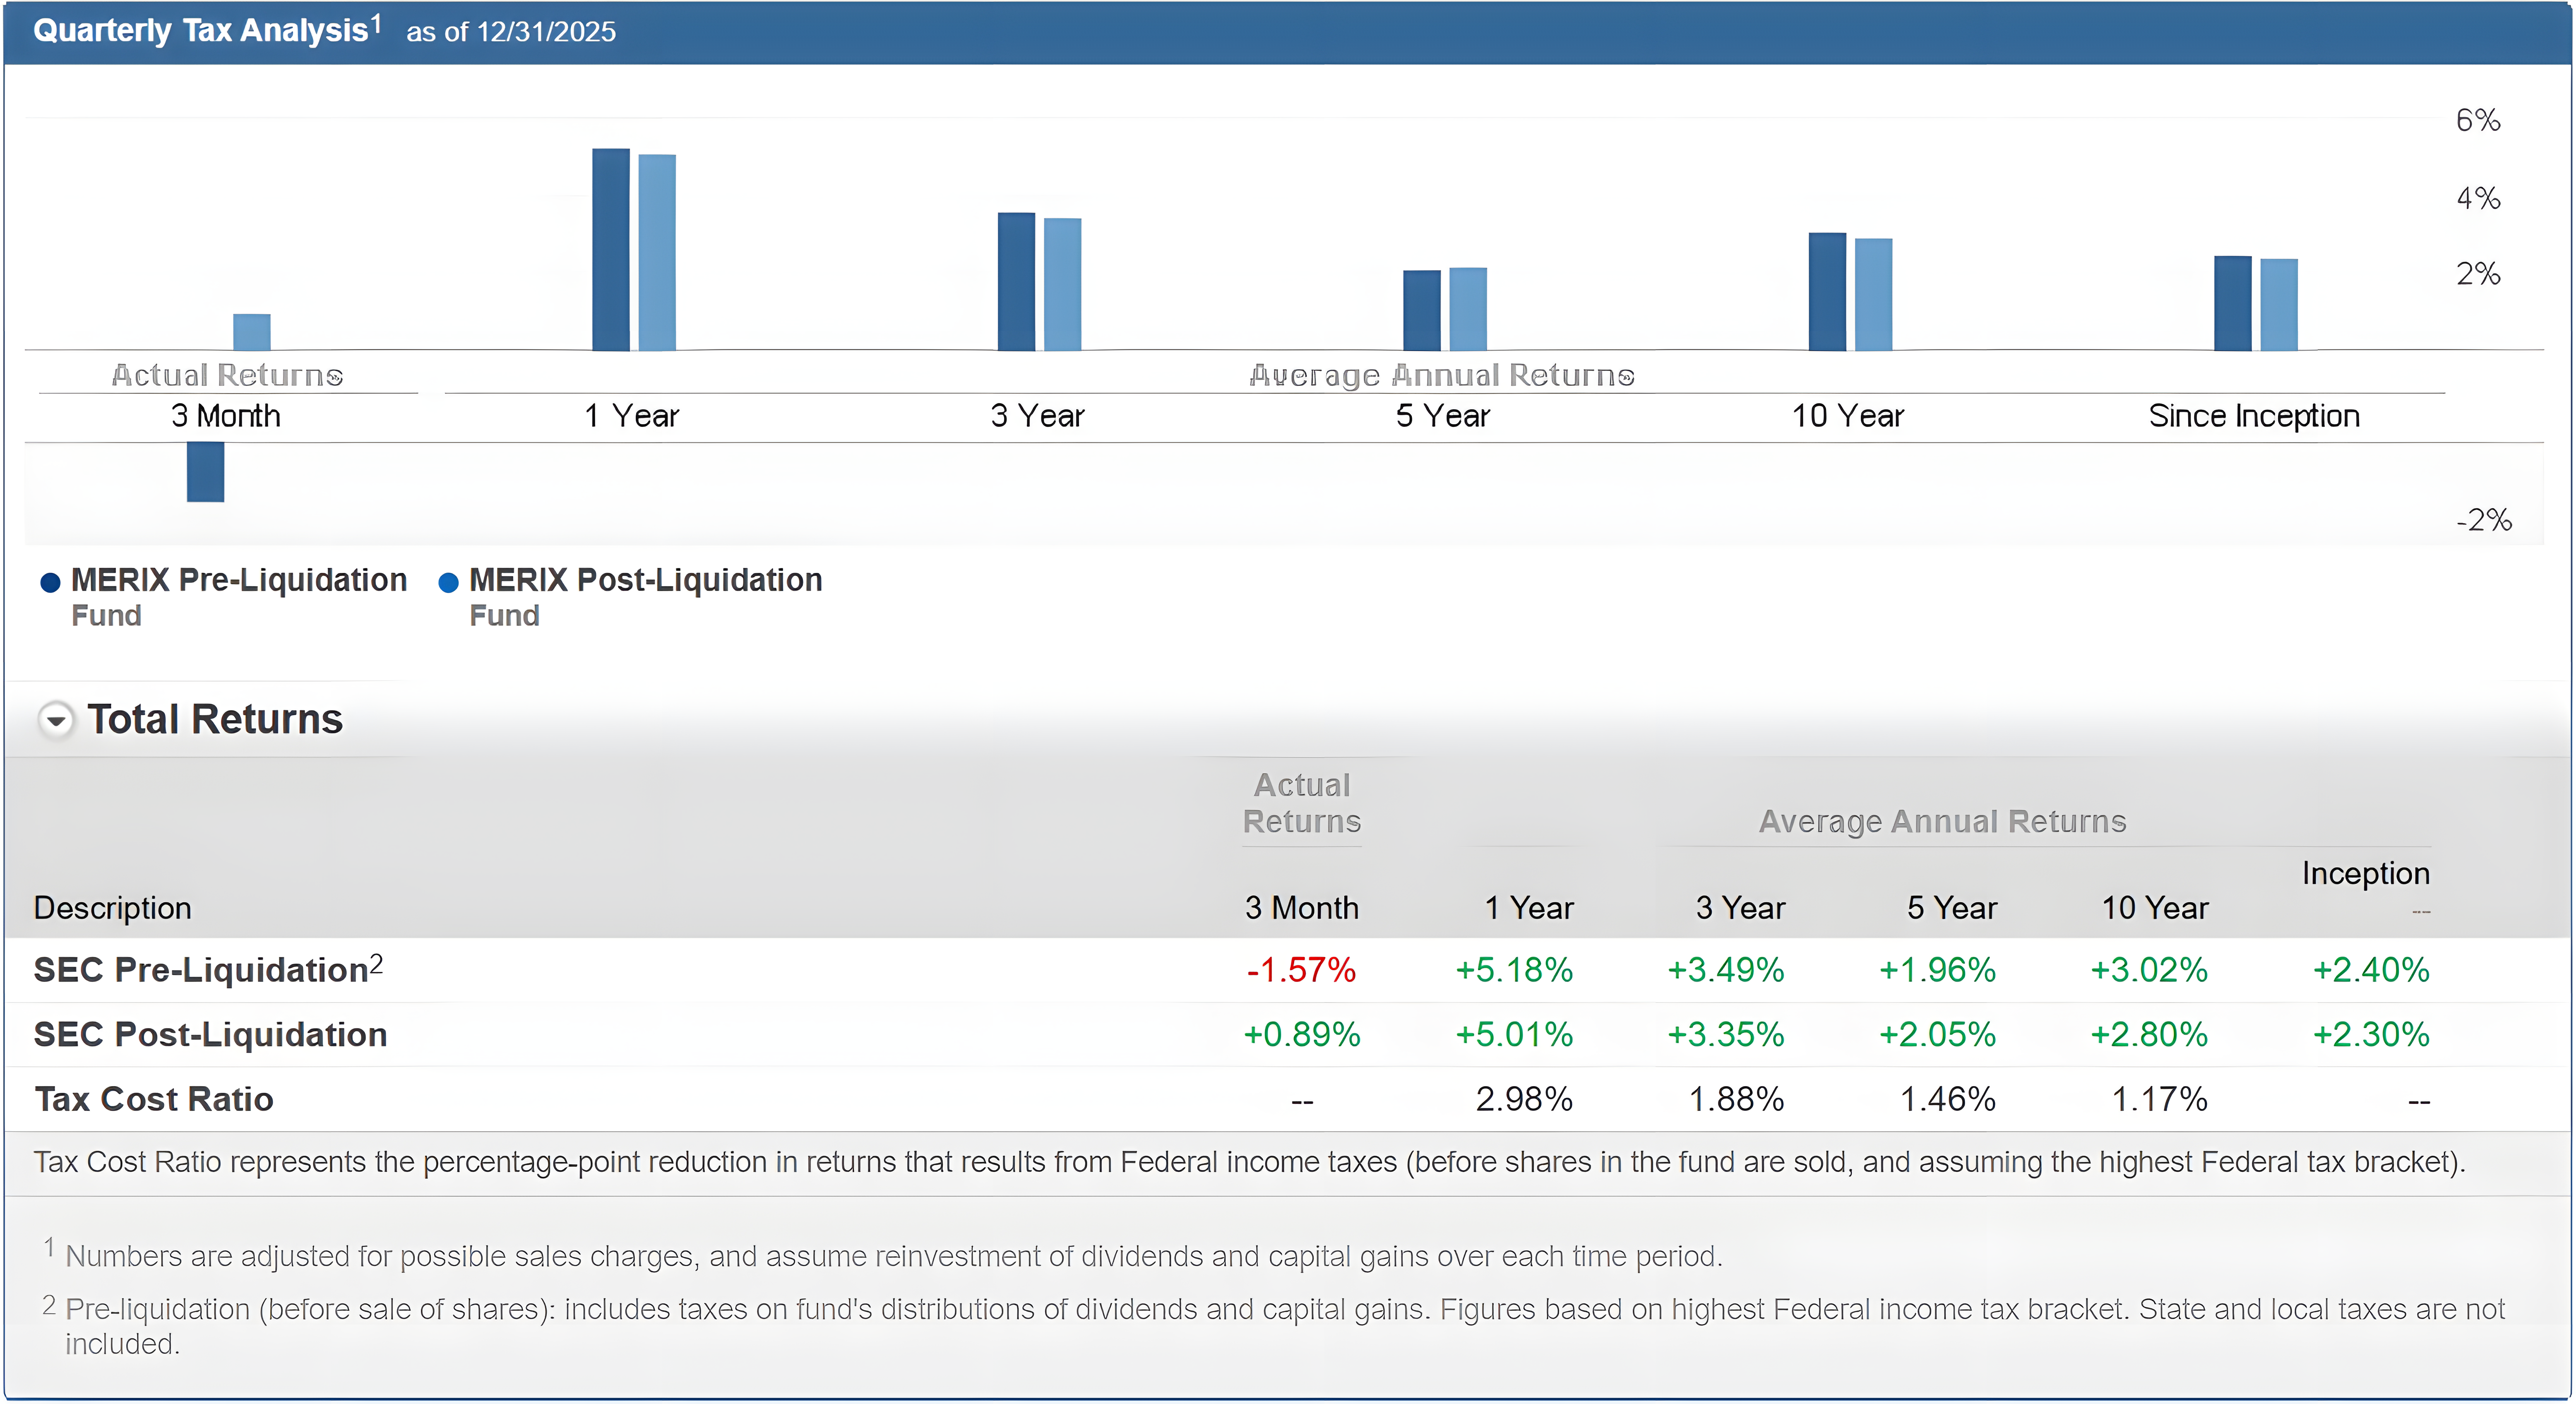
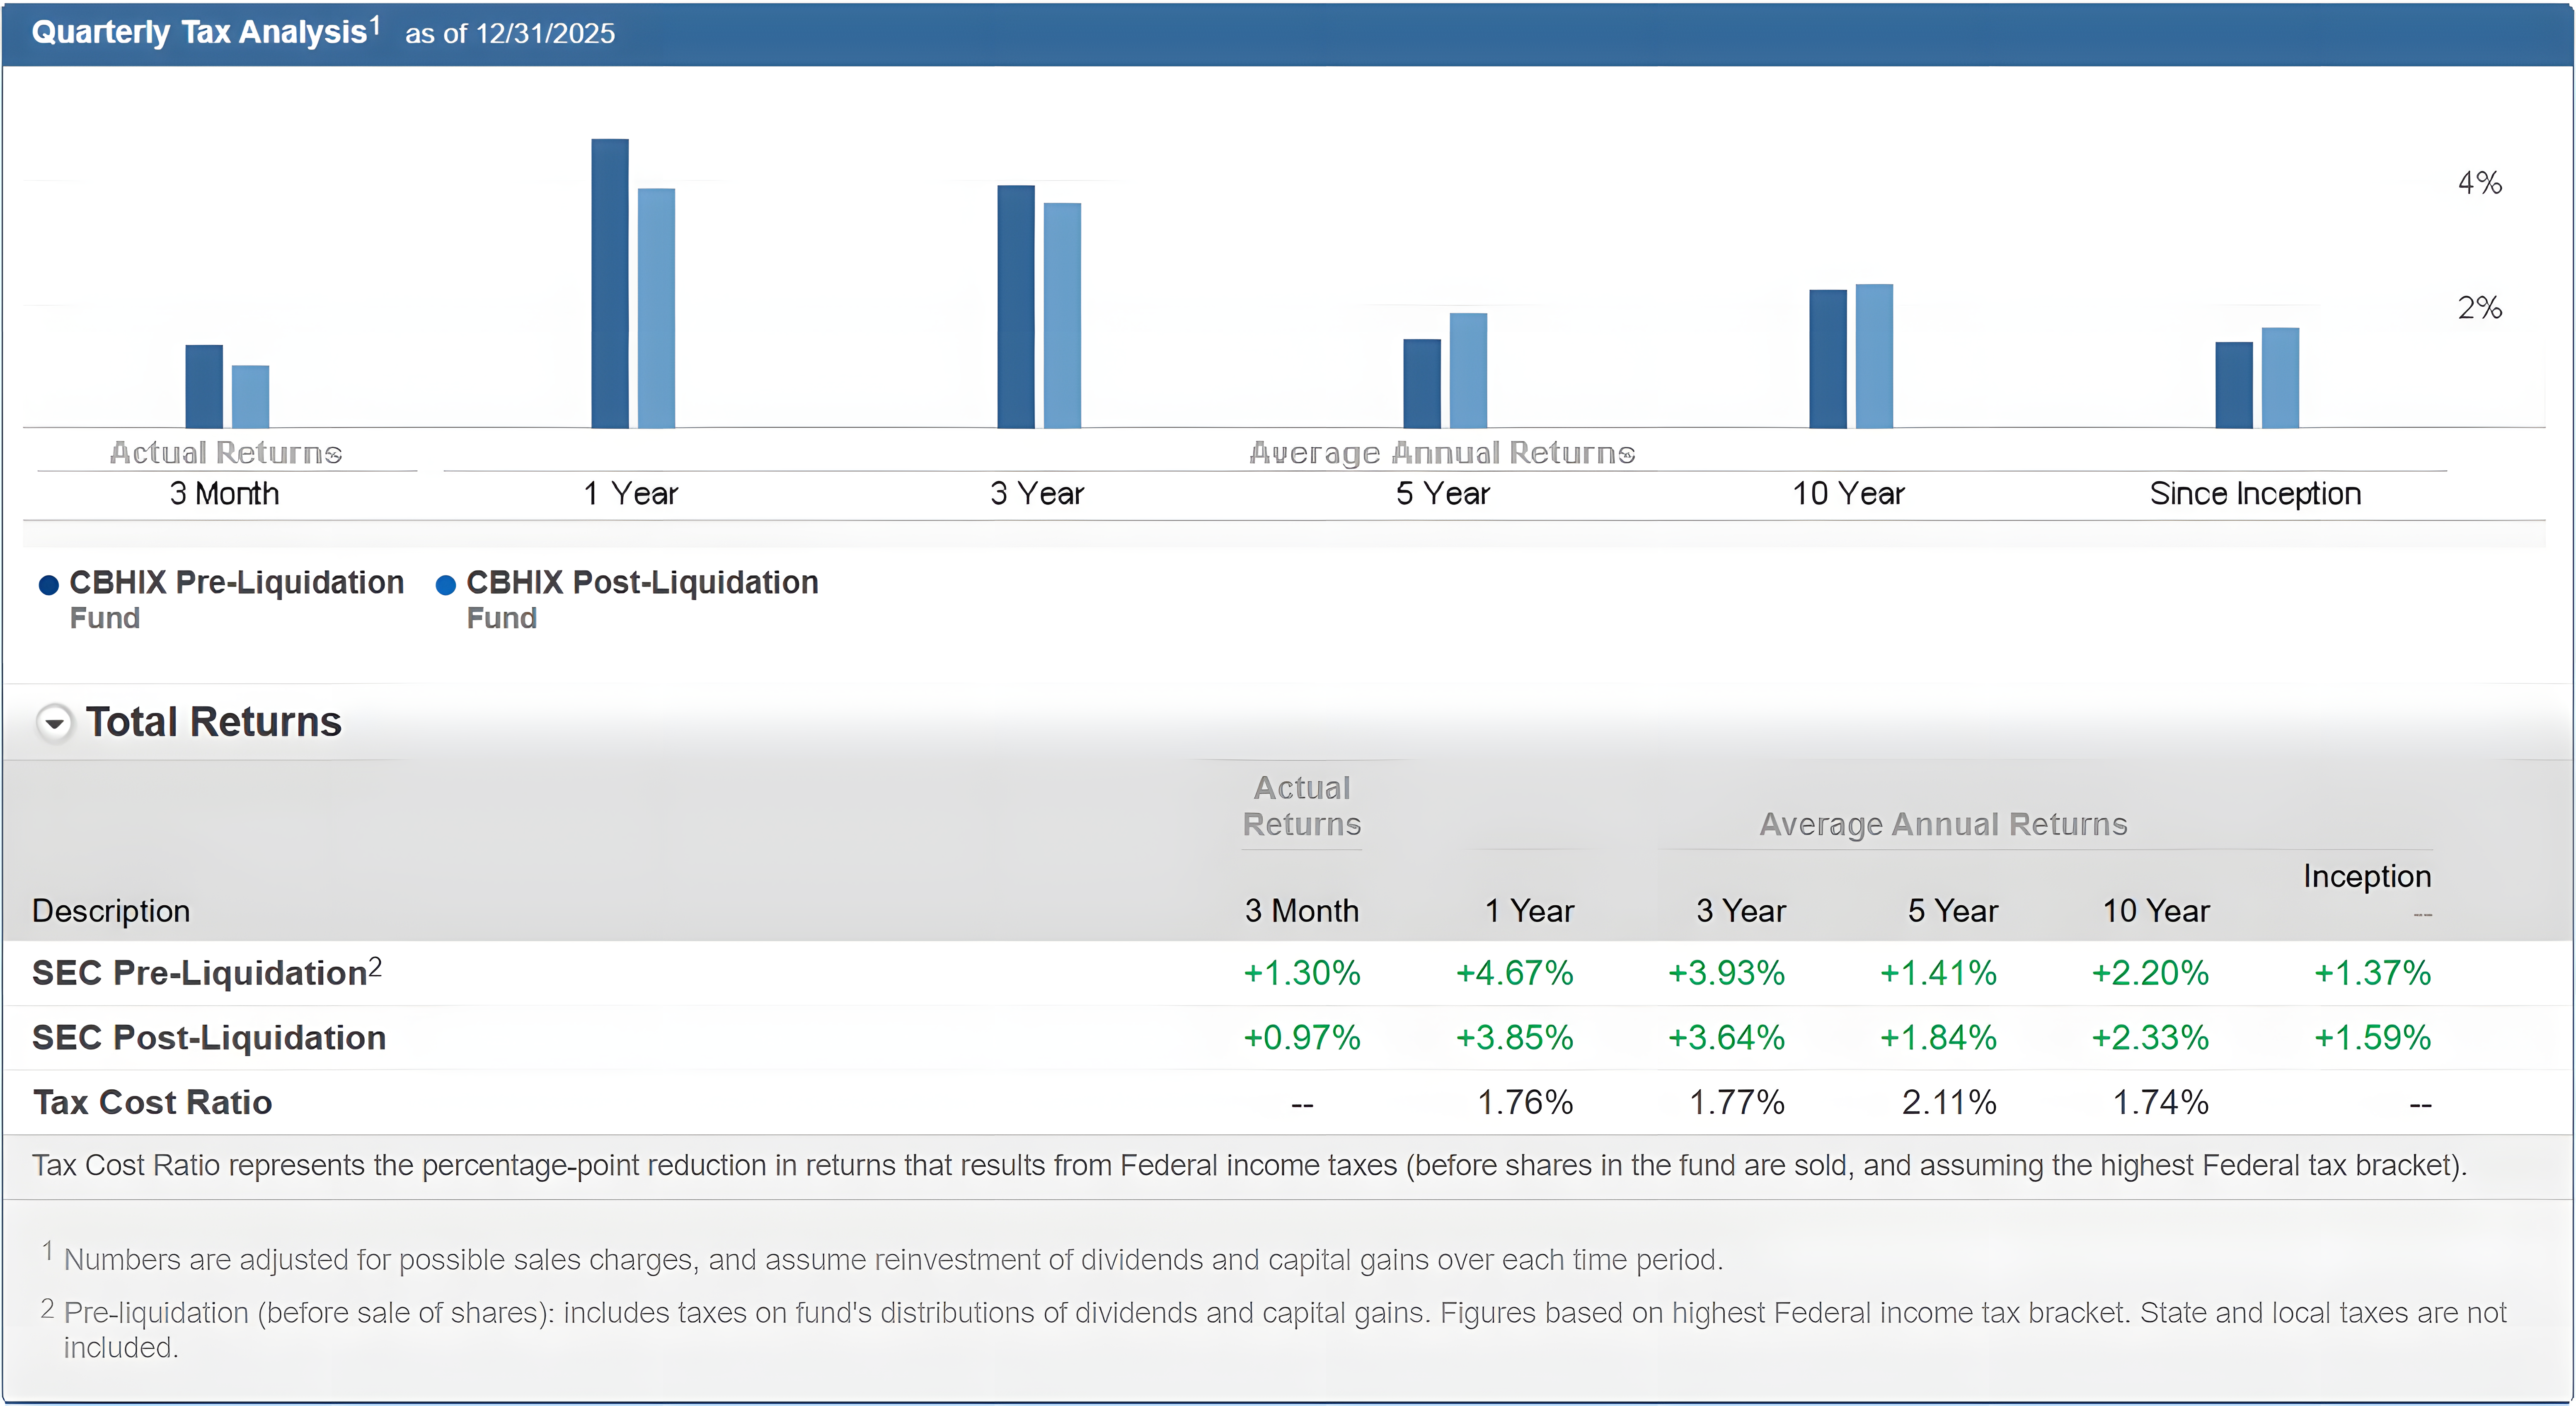
Important Risk Information
Investors should carefully consider the investment objectives, risk, charges, and expenses of the Fund. This and other important information about the Fund is contained in the prospectus, which can be obtained by calling (866) 738-1128 or at standpointfunds.com. Comparison funds’ prospectuses may be obtained by visiting the funds’ website. The prospectus should be read carefully before investing. The Standpoint Multi-Asset Fund is distributed by Ultimus Fund Distributors, LLC. Ultimus Fund Distributors, LLC is not affiliated with the other funds listed above.
Investing involves risk, including loss of principal. There is no guarantee that the fund will achieve its investment objective. Diversification does not guarantee a profit or protect against a loss.
Comparison funds are not advised by, or affiliated with, Standpoint. The funds are being shown for illustrative purposes only and should not be considered a recommendation.
Investing in underlying investment companies, including money market funds and ETFs, exposes the Fund to the investment performance (positive or negative) and risks of the investment companies. ETFs are subject to additional risks, including the risk that an ETFs shares may trade at a market price that is above or below its NAV. The Fund will indirectly bear a portion of the fees and expenses of the underlying fund in which it invests, which are in addition to the Fund’s own direct fees and expenses.
Investment in the Fund carries certain risks. The fund will invest a percentage of its assets in derivatives, such as futures and commodities. The use of such derivatives and the resulting high portfolio turnover may expose the Fund to additional risks that it would not be subject to if it invested directly in the securities and commodities underlying those derivatives. The Fund may experience losses that exceed those experienced by funds that do not use futures contracts. The successful use of futures contracts draws upon the Adviser’s skill and experience with respect to such instruments and are subject to special risk considerations. The primary risks associated with the use of futures contracts are (a) the imperfect correlation between the change in market value of the instruments held by the Fund and the price of the forward or futures contract; (b) possible lack of a liquid secondary market for a forward or futures contract and the resulting inability to close a forward or futures contract when desired;(c) losses caused by unanticipated market movements, which are potentially unlimited; (d) the Adviser’s inability to predict correctly the direction of securities prices, interest rates, currency exchange rates and other economic factors; (e) the possibility that the counterparty will default in the performance of its obligations; and (f) if the Fund has insufficient cash, it may have to sell securities from its portfolio to meet daily variation margin requirements, and the Fund may have to sell securities at a time when it may be disadvantageous to do so.
Foreign investing involves risks not typically associated with US investments, including adverse fluctuations in foreign currency values, adverse political, social, and economic developments, less liquidity, greater volatility, less developed or less efficient trading markets, political instability and differing auditing and legal standards.
© 2025 Morningstar, Inc. All Rights Reserved. The information contained: (1) is proprietary to Morningstar and/or its content providers; (2) may not be copied or distributed; and (3) is not warranted to be accurate, complete, or timely. Neither Morningstar nor its content providers are responsible for any damages or losses arising from any use of this information.
Definitions
Sharpe Ratio is the ratio which measures risk-adjusted performance. Max Decline is the peak-to-trough decline during a specific period.
The comparison funds referenced were chosen based on a series of parameters which include a ranking of the largest 20 open-ended liquid alternative mutual funds as categorized by Morningstar with an inception date prior to 1/1/2020, by assets under management (AUM). The funds used in this comparison are well known liquid alternative funds and therefore may be more widely used among financial advisors.
Like the Standpoint Fund, the comparison funds are all open-ended mutual funds with daily liquidity. These investments are all subject to fluctuation of principal or return, and past performance is not a guarantee of future performance. The investment return and principal value of an investment will fluctuate so that an investor's shares, when redeemed, may be worth more or less than their original cost.
Regarding the Liquid Alternatives Category Group: These are publicly available investments that employ alternative strategies aimed at capital preservation, long-term portfolio diversification, or enhanced risk-adjusted returns. Alternative strategies are described as those that attempt to expand, diversify, or eliminate the dominant risk factors contained in traditional market indexes (such as equity, credit, and rate indexes). They may be applied across single or multiple asset classes using various investment techniques, have the ability to short securities, and aim to provide differentiated and/or diversifying exposures with little correlation to traditional market indexes. This distinguishes them from strategies that primarily modify traditional market risks.
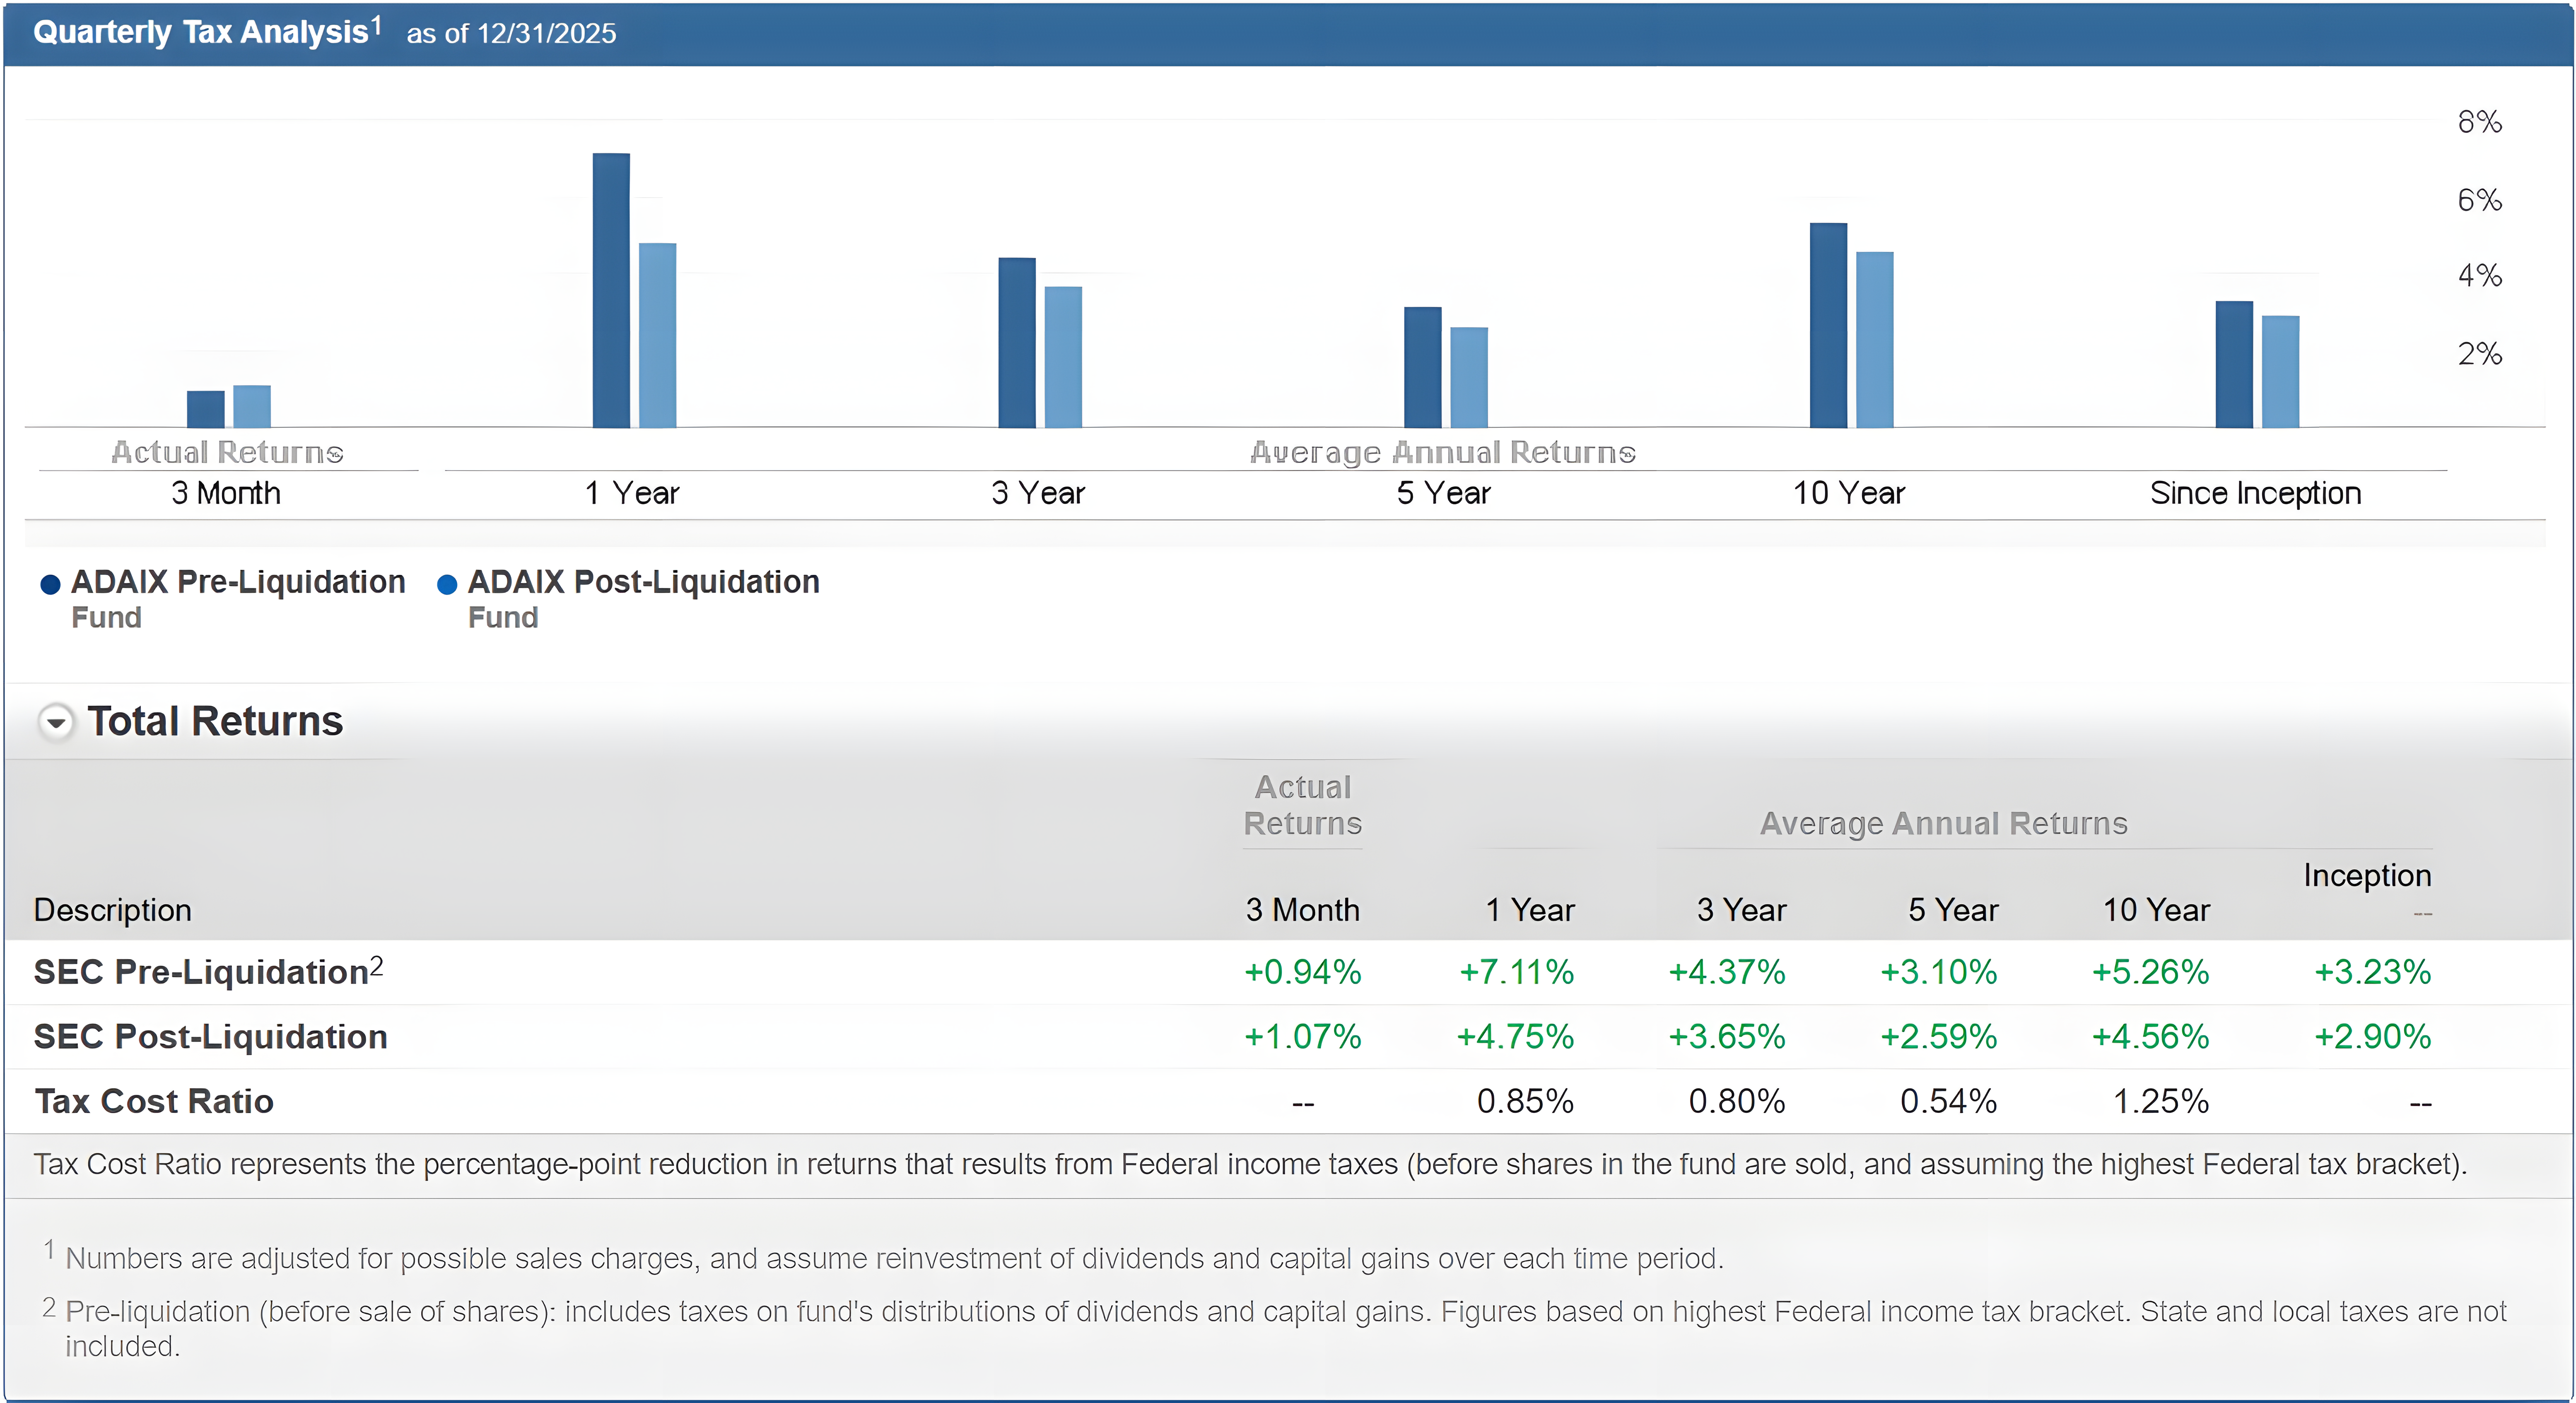
Standpoint Multi-Asset Institutional: Gross expense ratio: 1.39%, net expense ratio: 1.26%, expense limitation contractual through 2/28/2027.
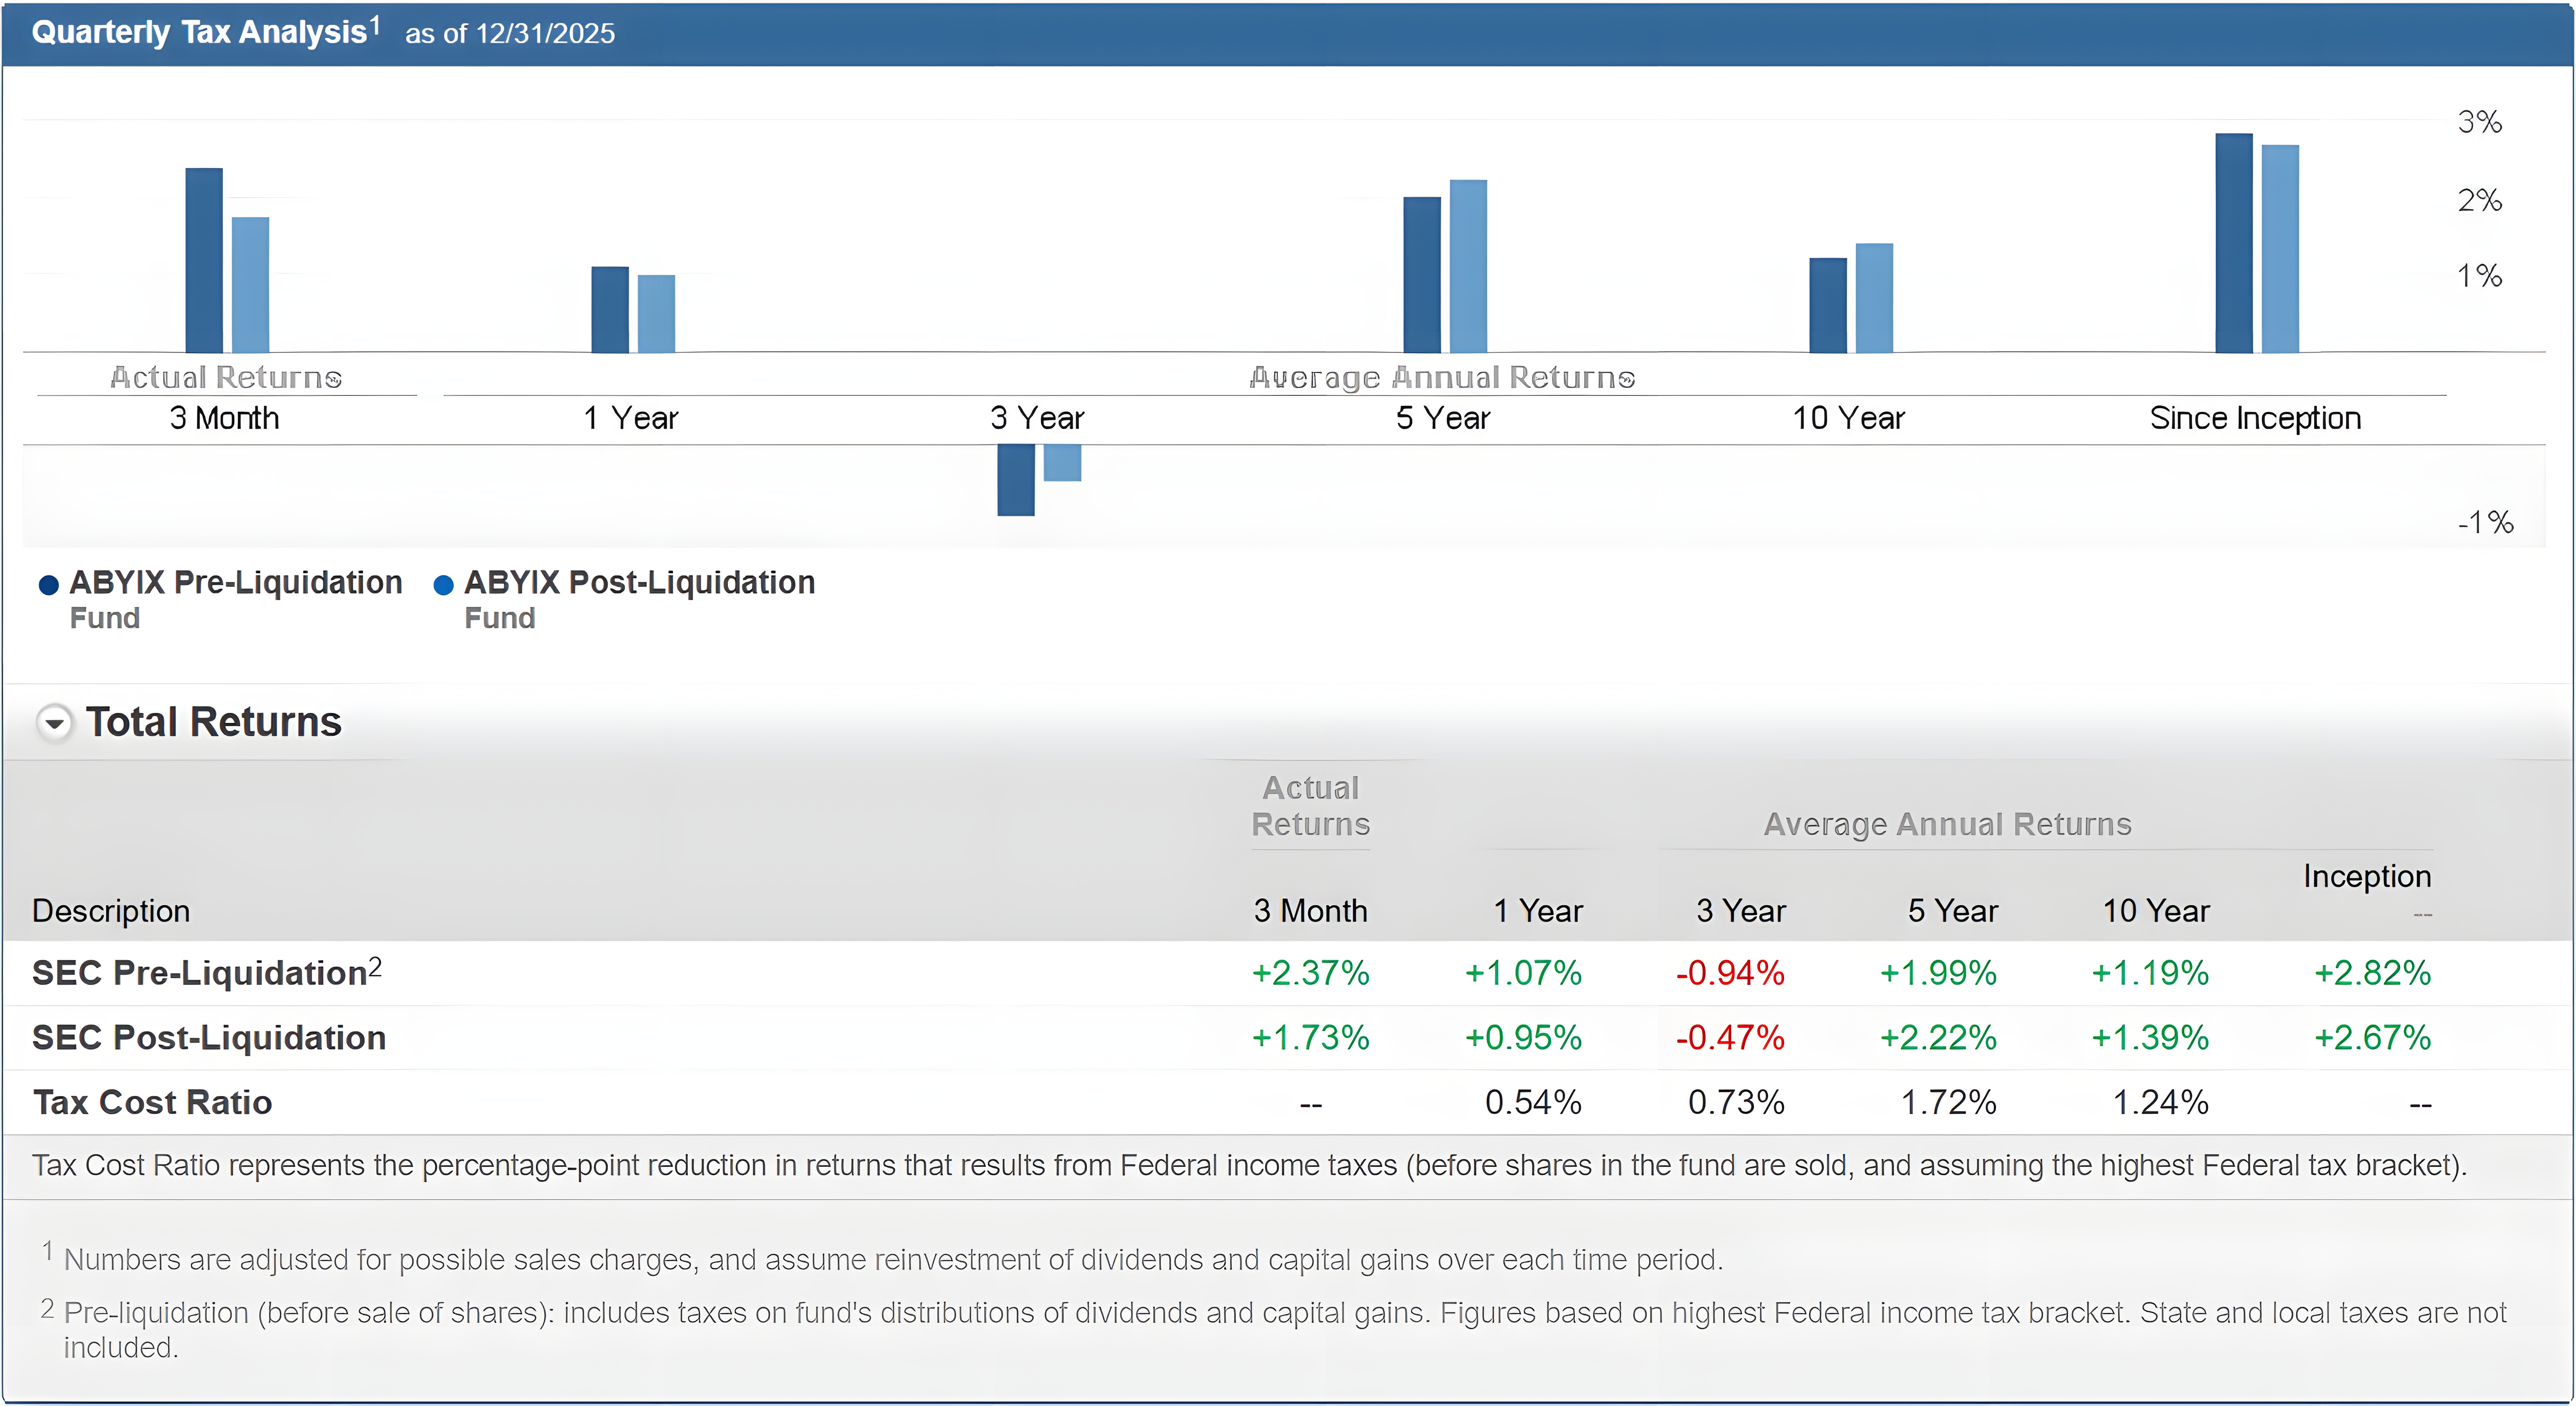
Abbey Capital Futures Strategy I: Gross expense ratio: 1.85%, net expense ratio: 1.79%, expense limitation contractual through 12/31/2025.
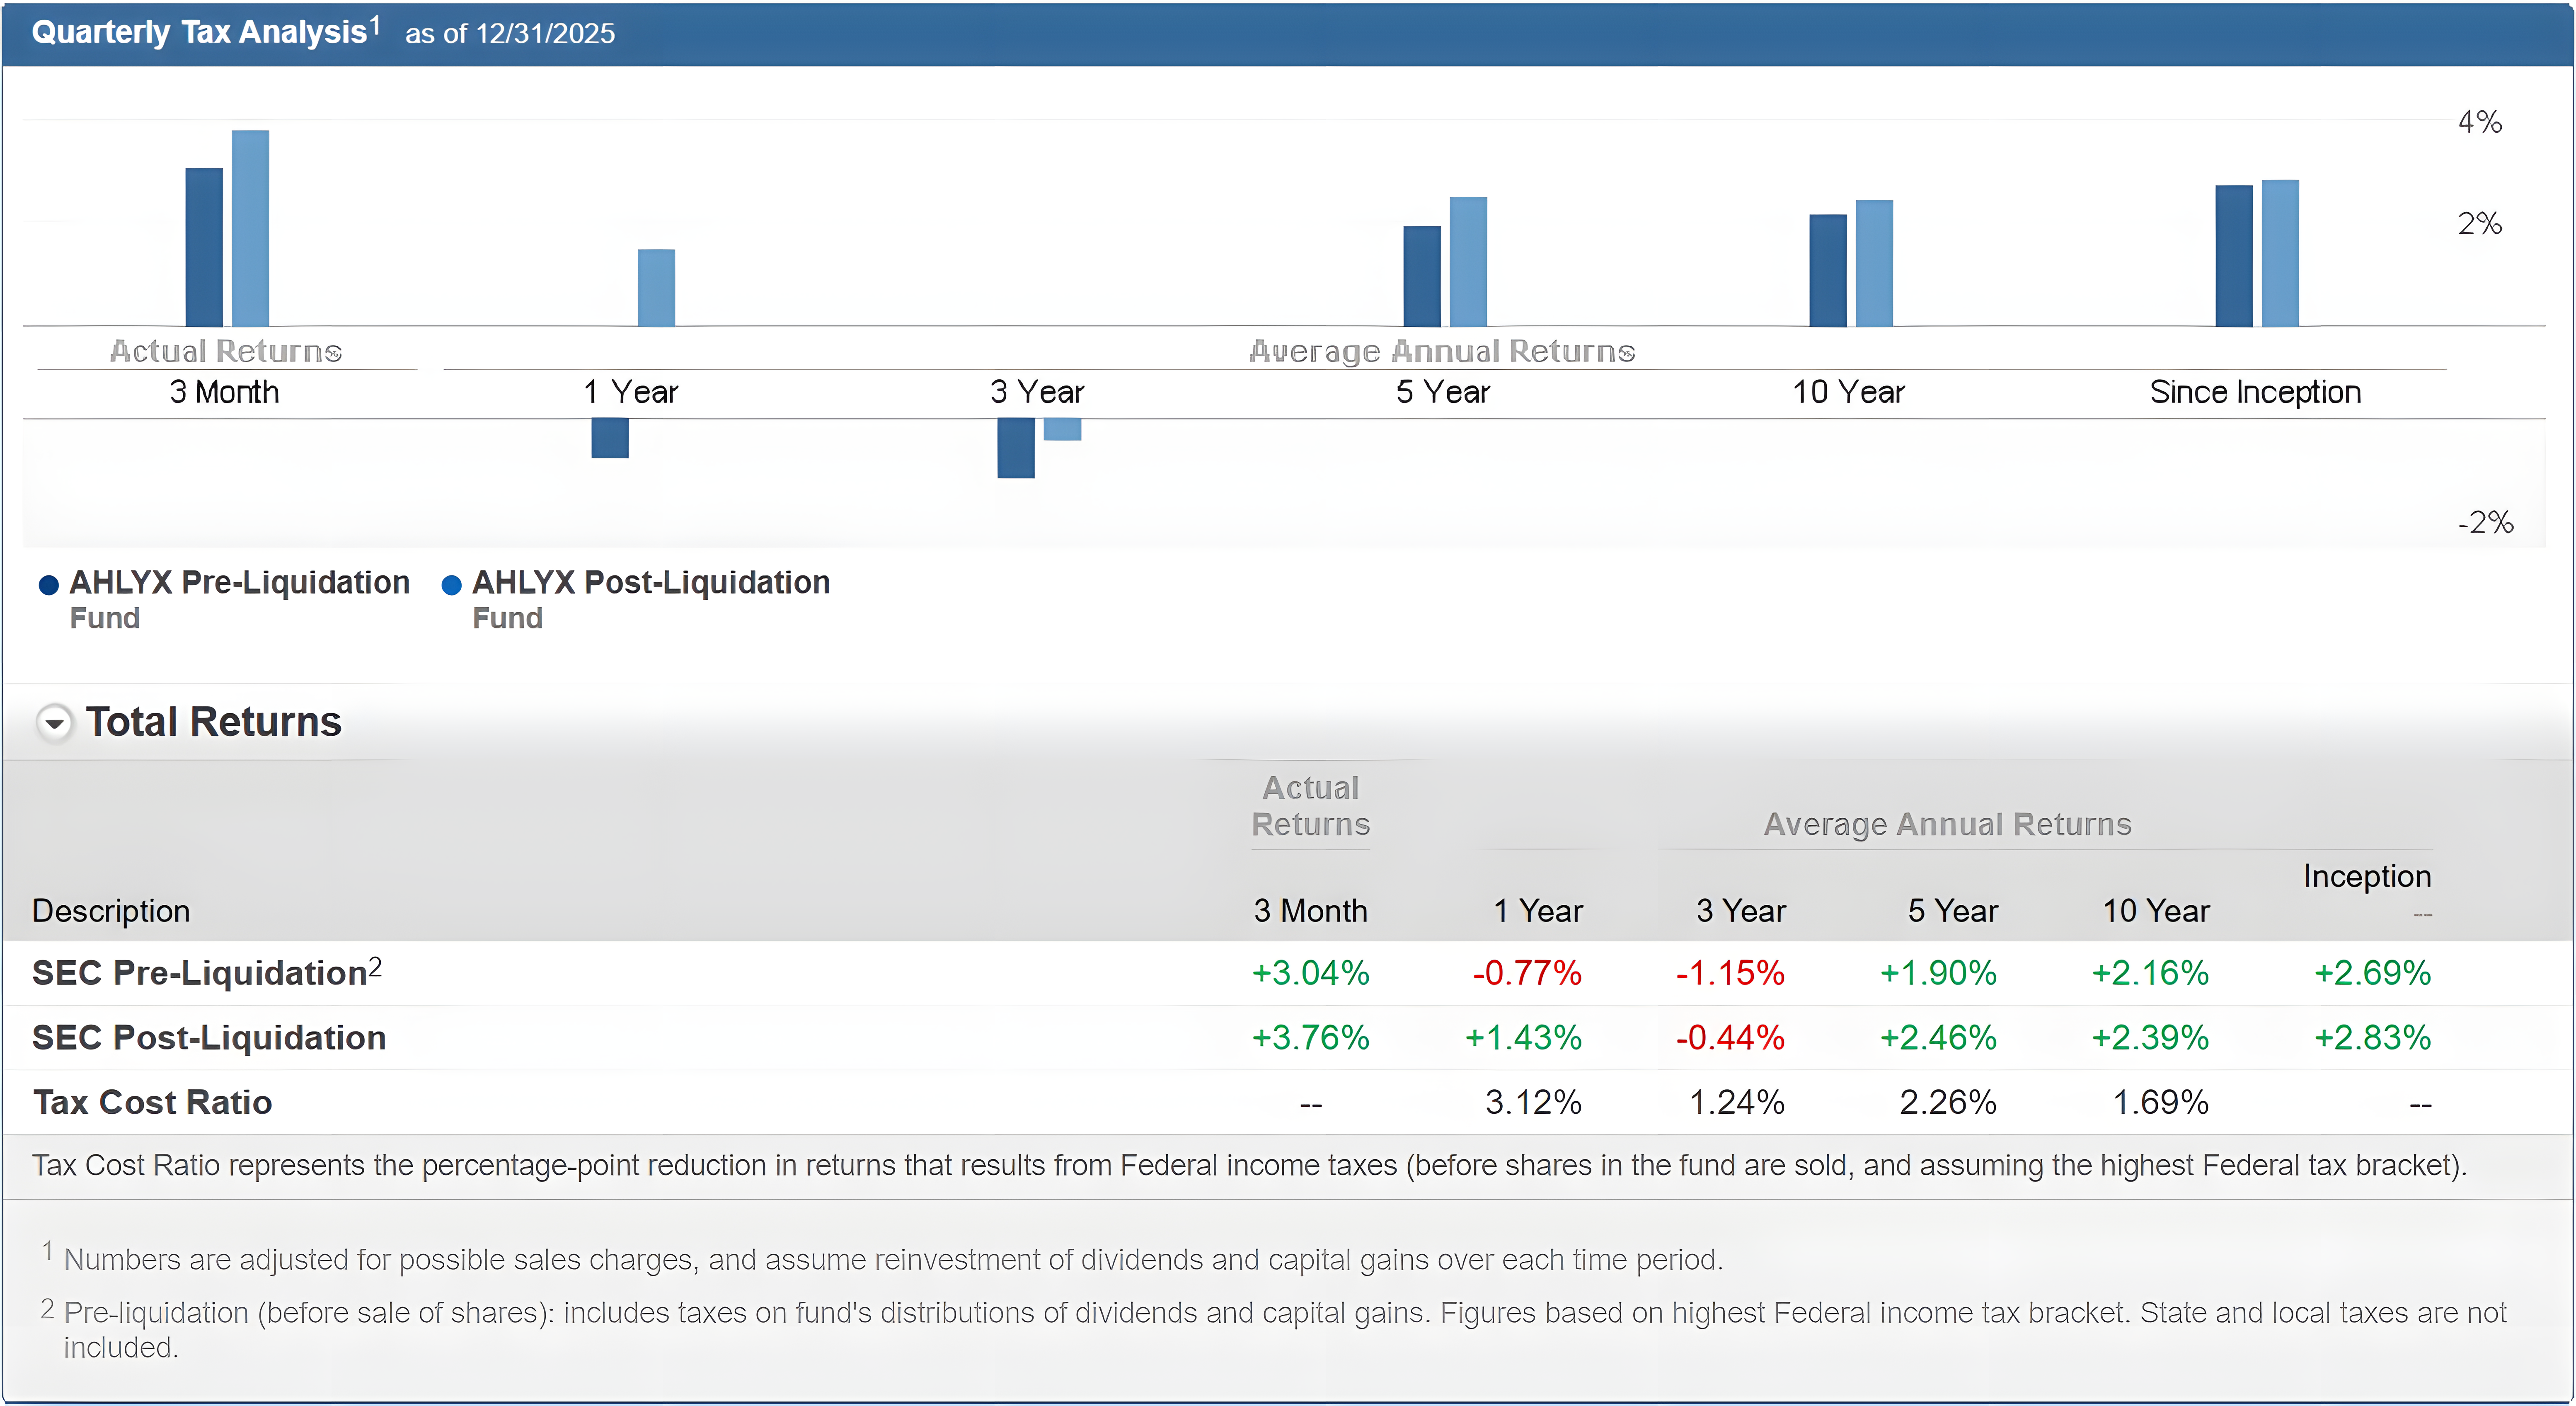
American Beacon AHL Mgd Futs Strat Y: Gross expense ratio: 1.63%, net expense ratio: 1.63%, no expense limitation agreement.
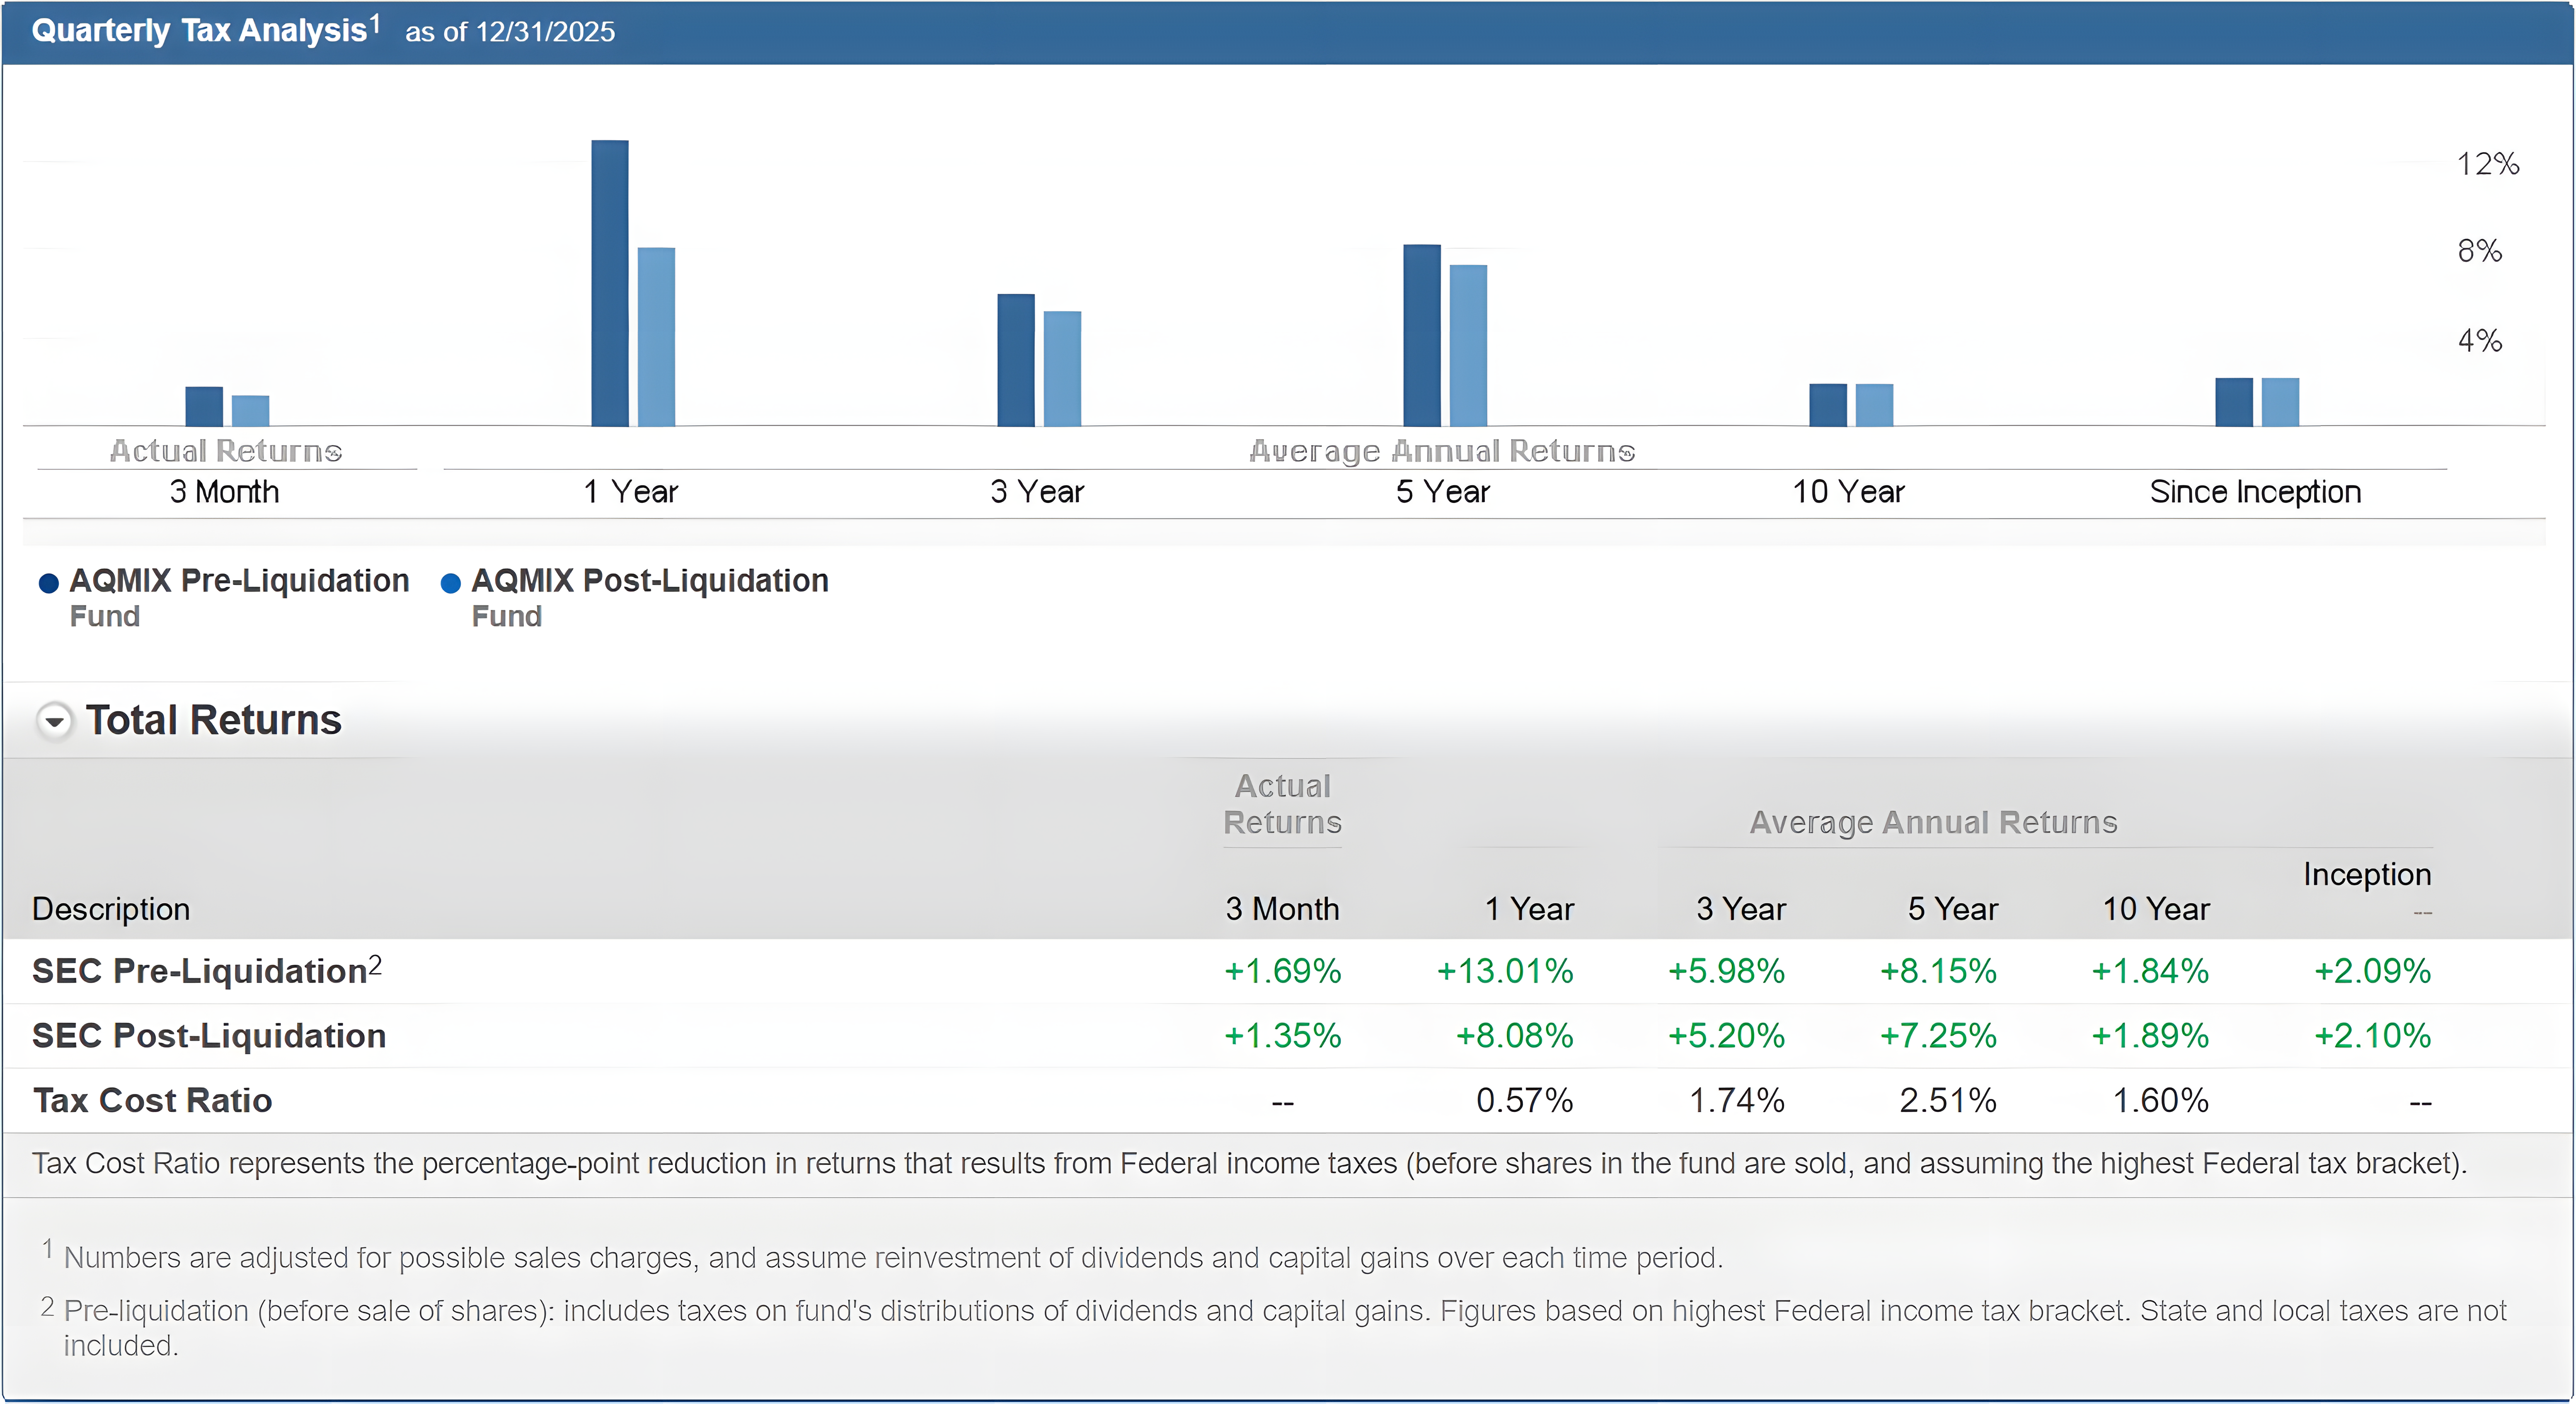
AQR Diversified Arbitrage I: Gross expense ratio: 1.87%, net expense ratio: 1.87%, expense limitation contractual through 4/30/2026.
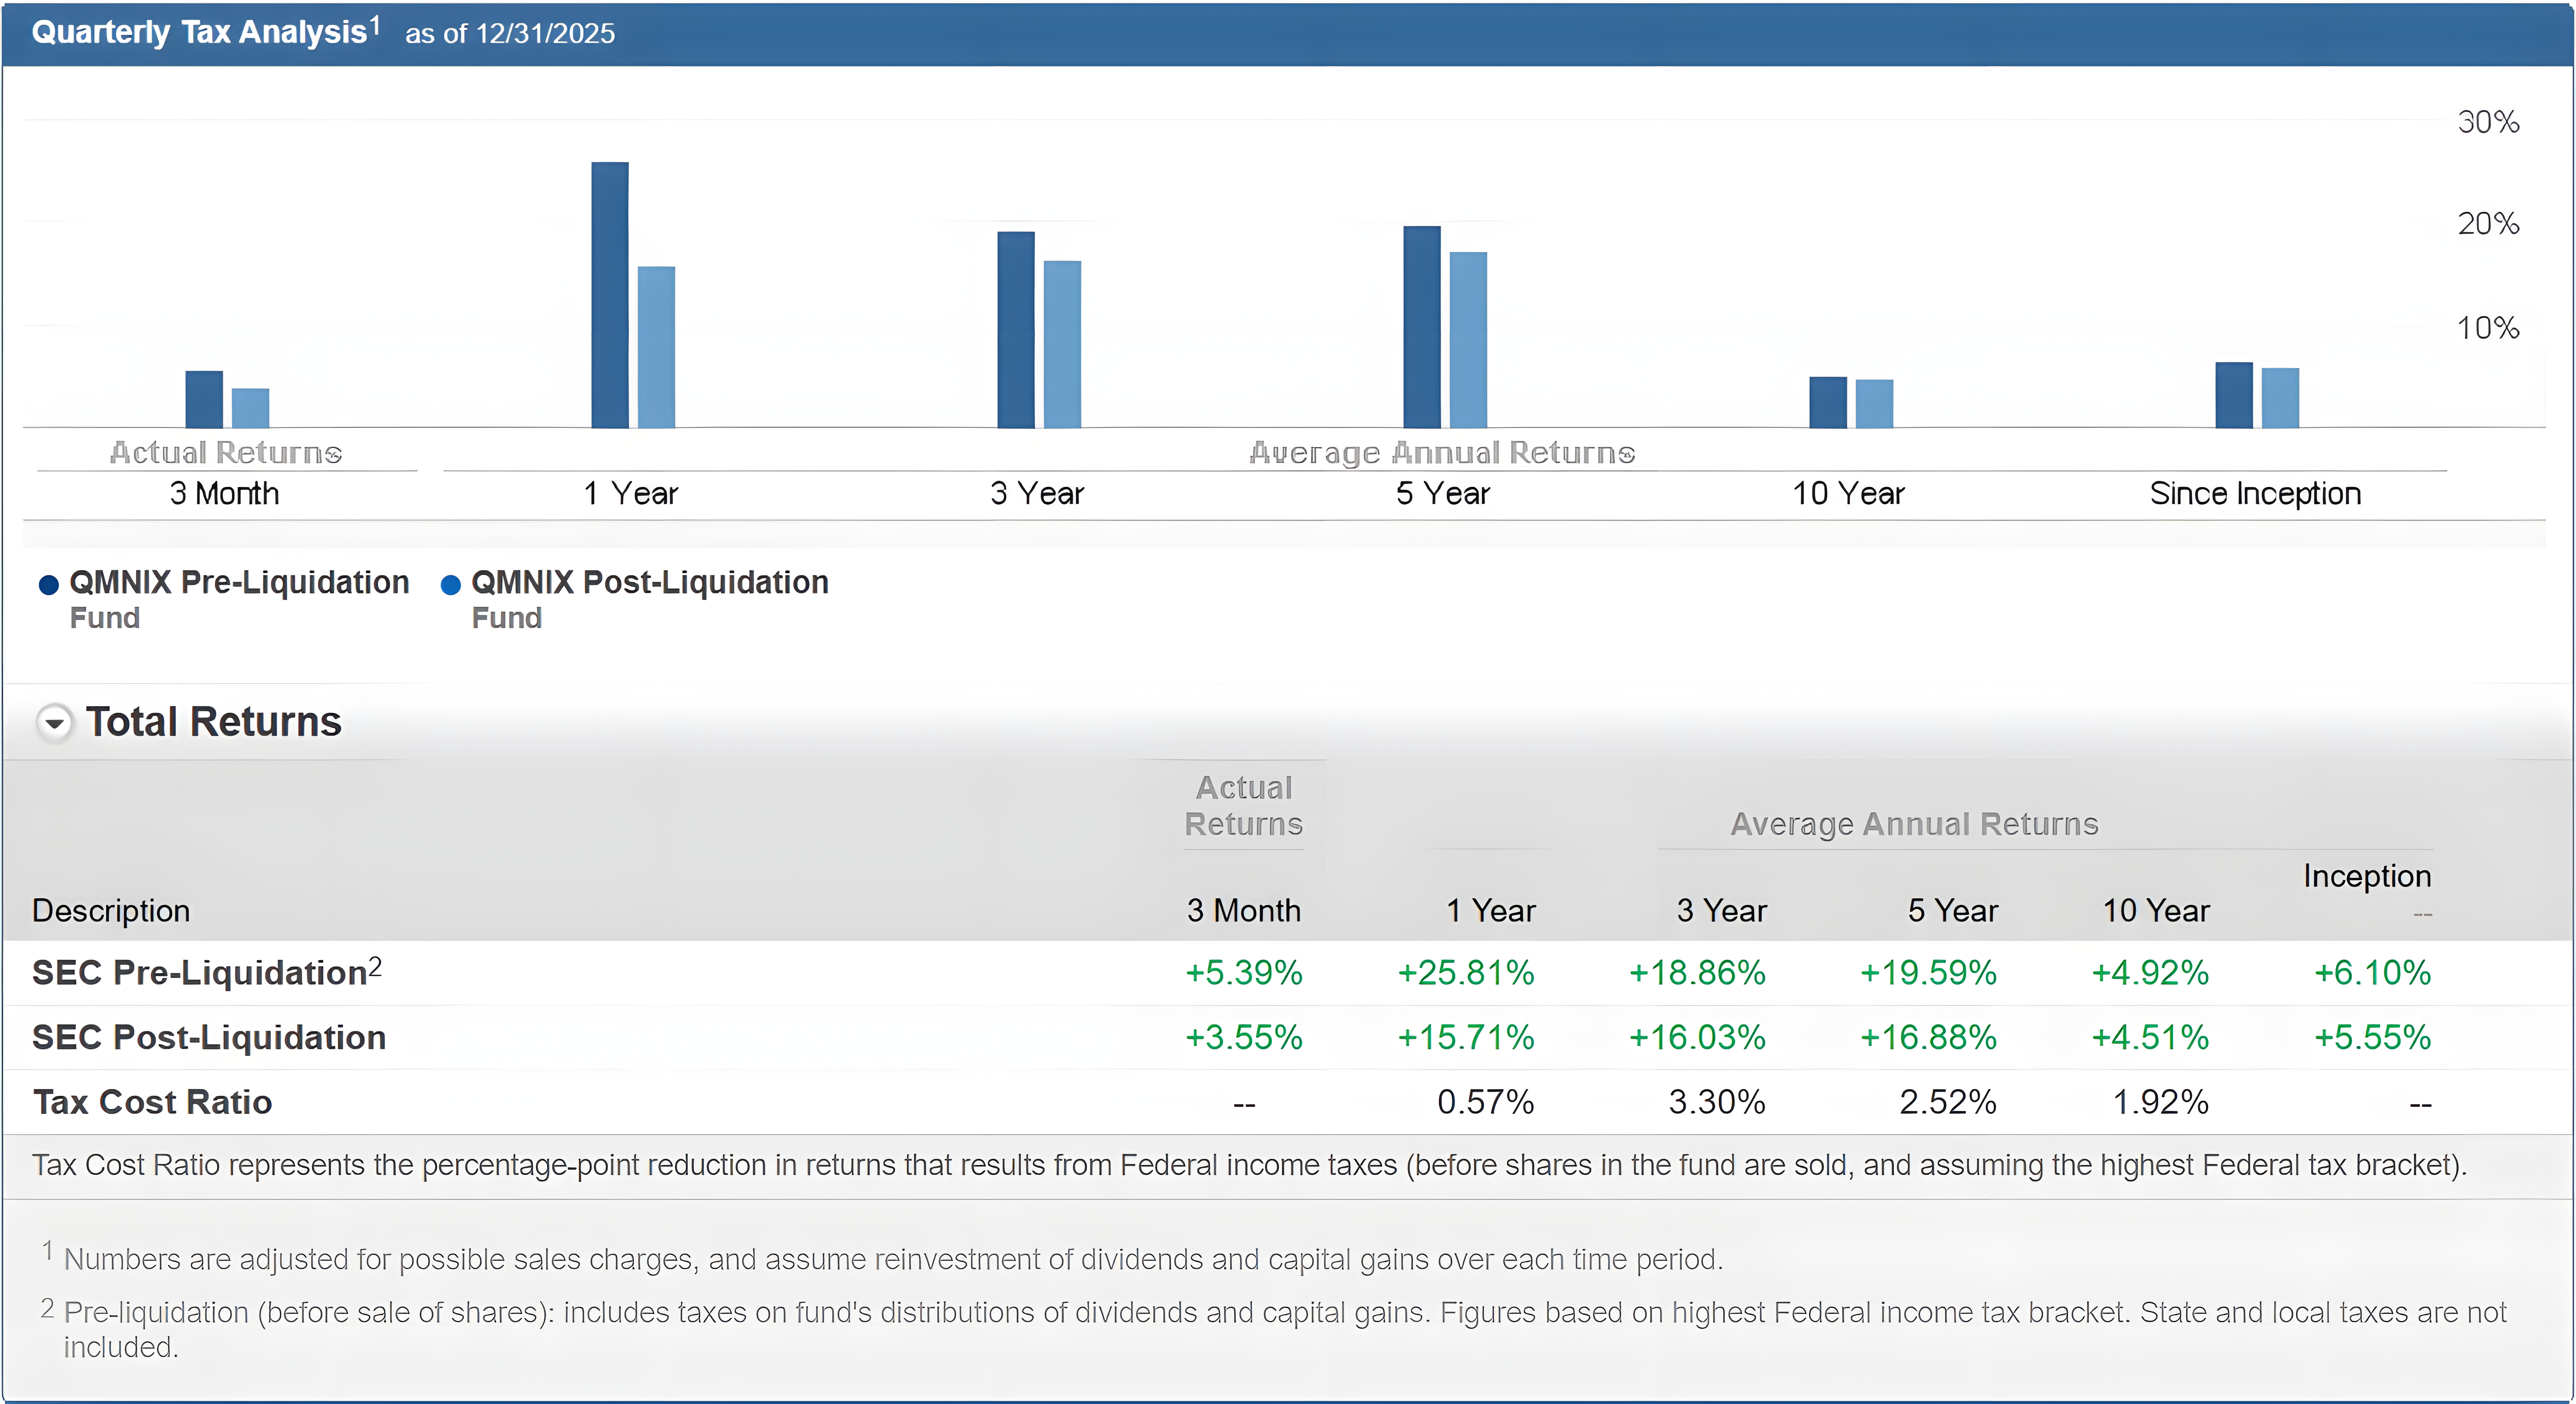
AQR Equity Market Neutral I: Gross expense ratio: 5.49%, net expense ratio: 5.48%, expense limitation contractual through 4/30/2026.
AQR Managed Futures Strategy I: Gross expense ratio: 2.73%, net expense ratio: 2.72%, expense limitation contractual through 4/30/2026.
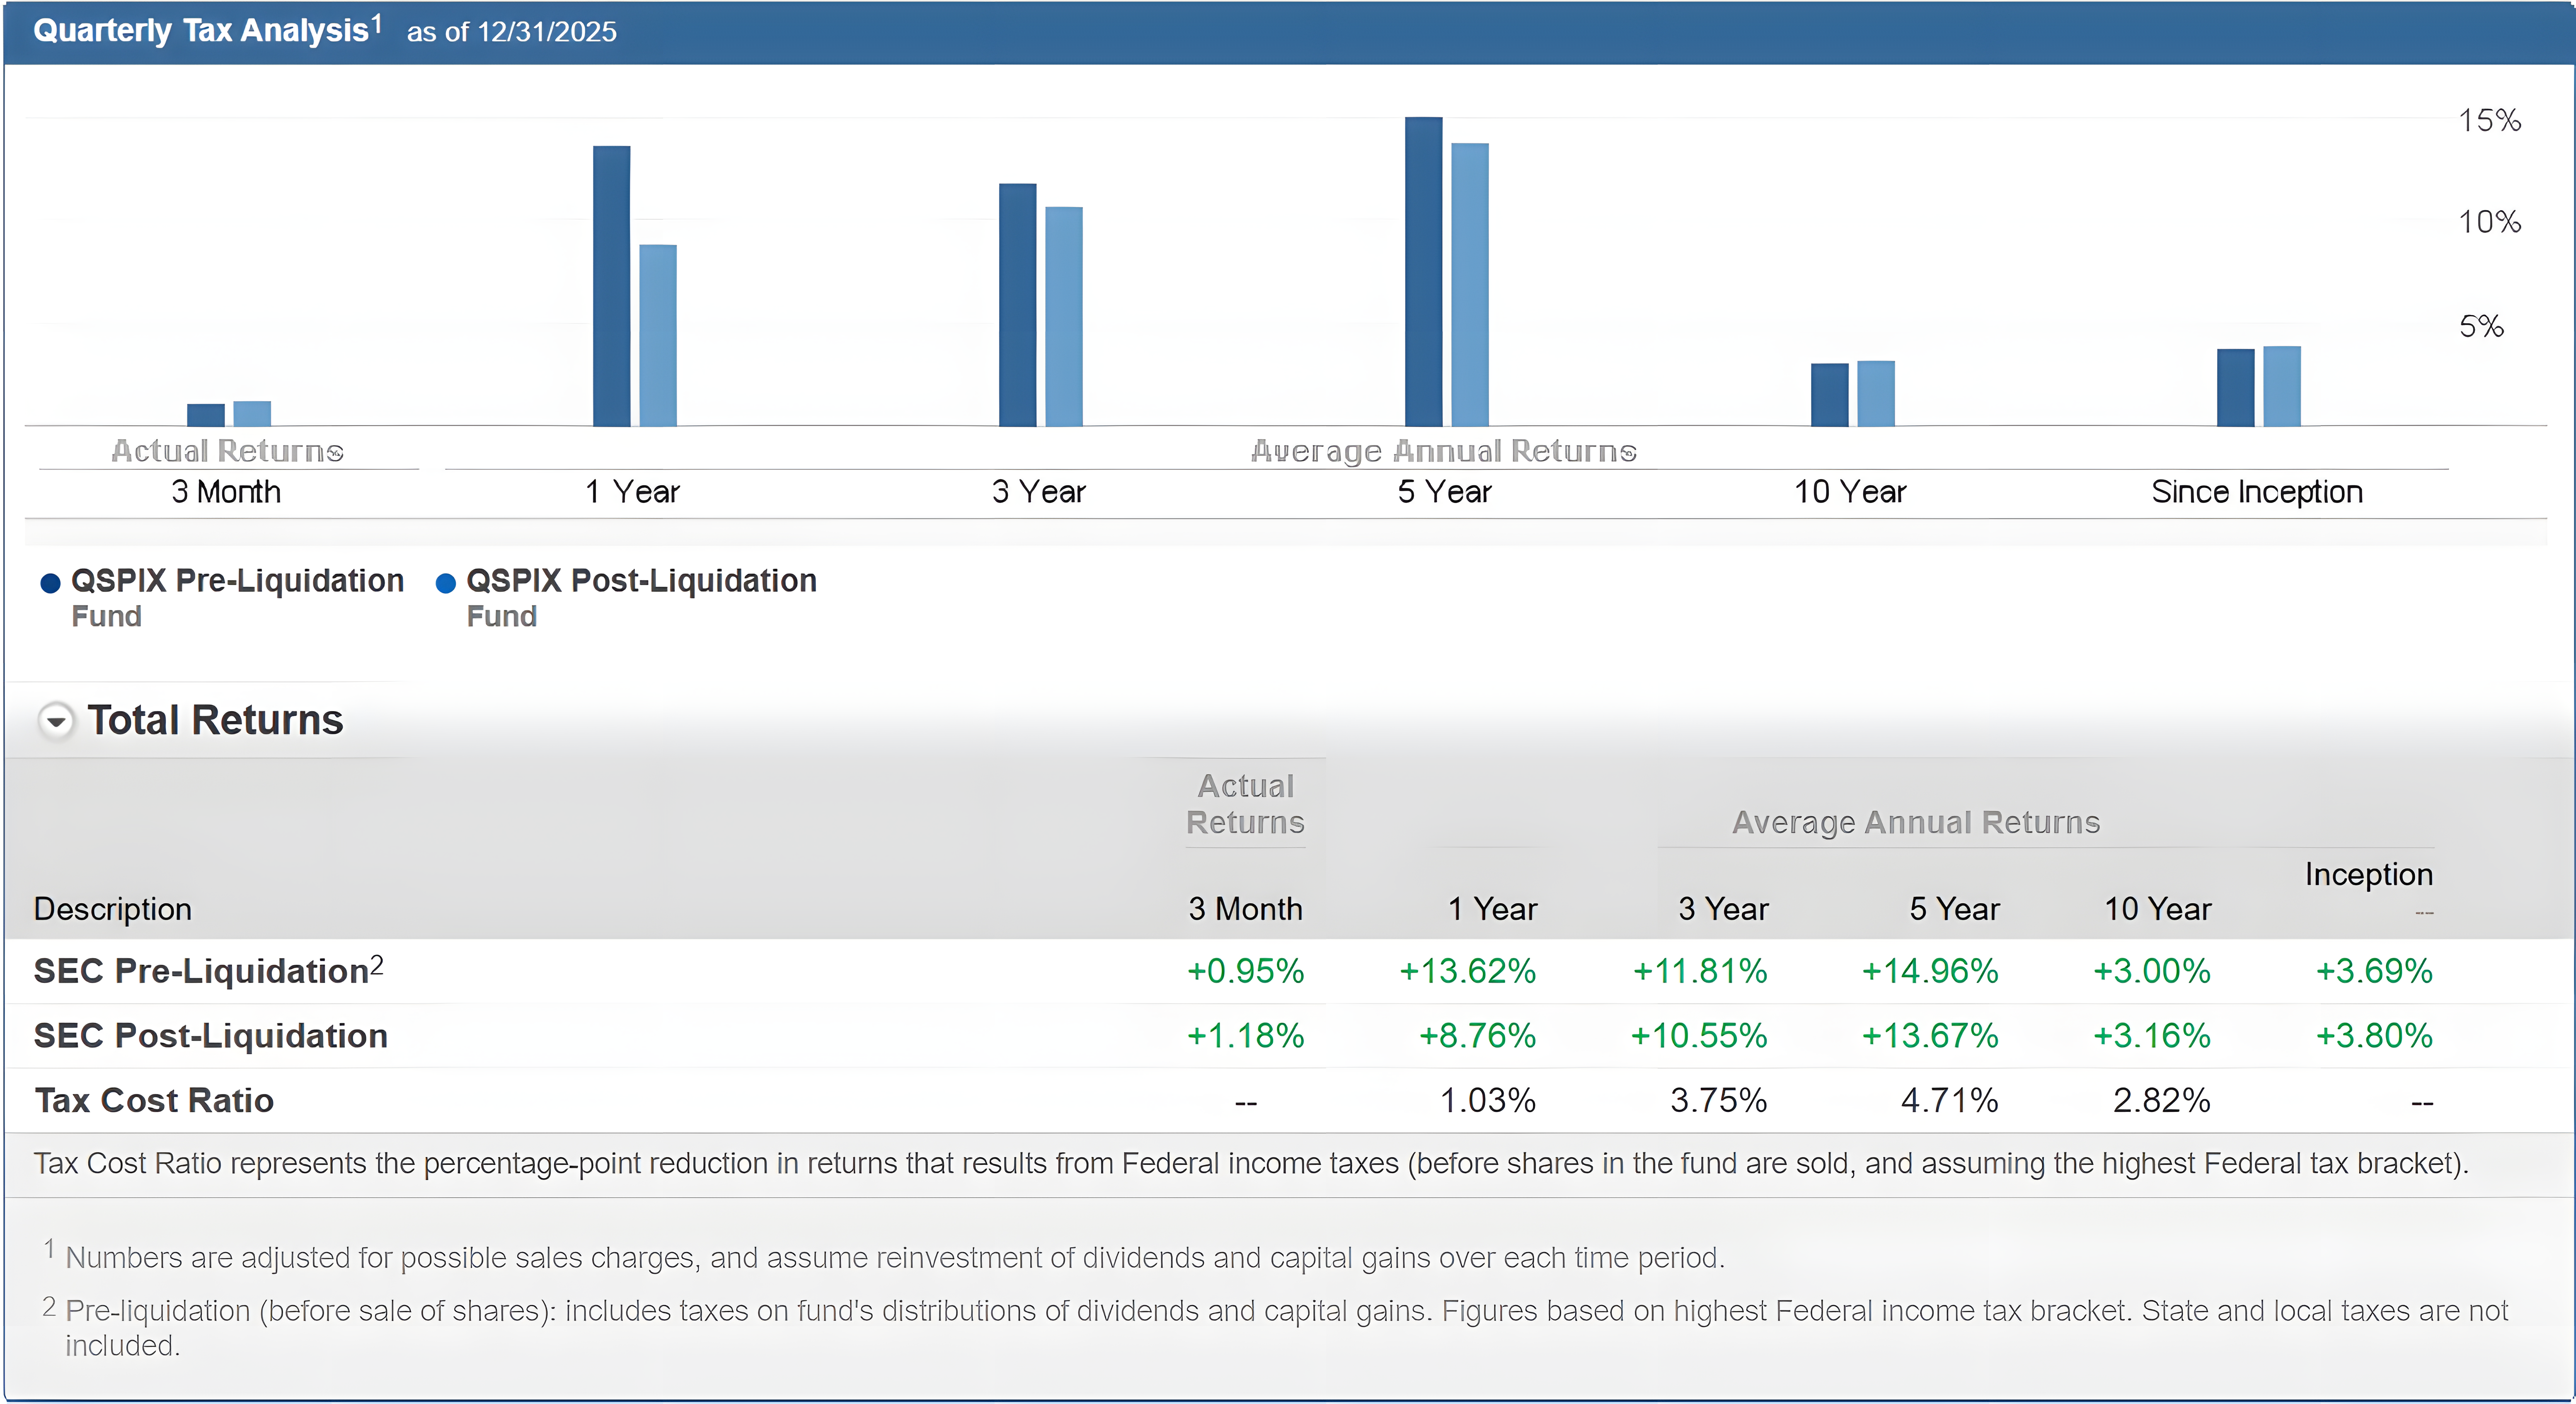
AQR Style Premia Alternative I: Gross expense ratio: 5.89%, net expense ratio: 5.89%, expense limitation contractual through 4/30/2026.
BlackRock Event Driven Equity Instl: Gross expense ratio: 1.37%, net expense ratio: 1.29%, expense limitation contractual through 6/30/2026.
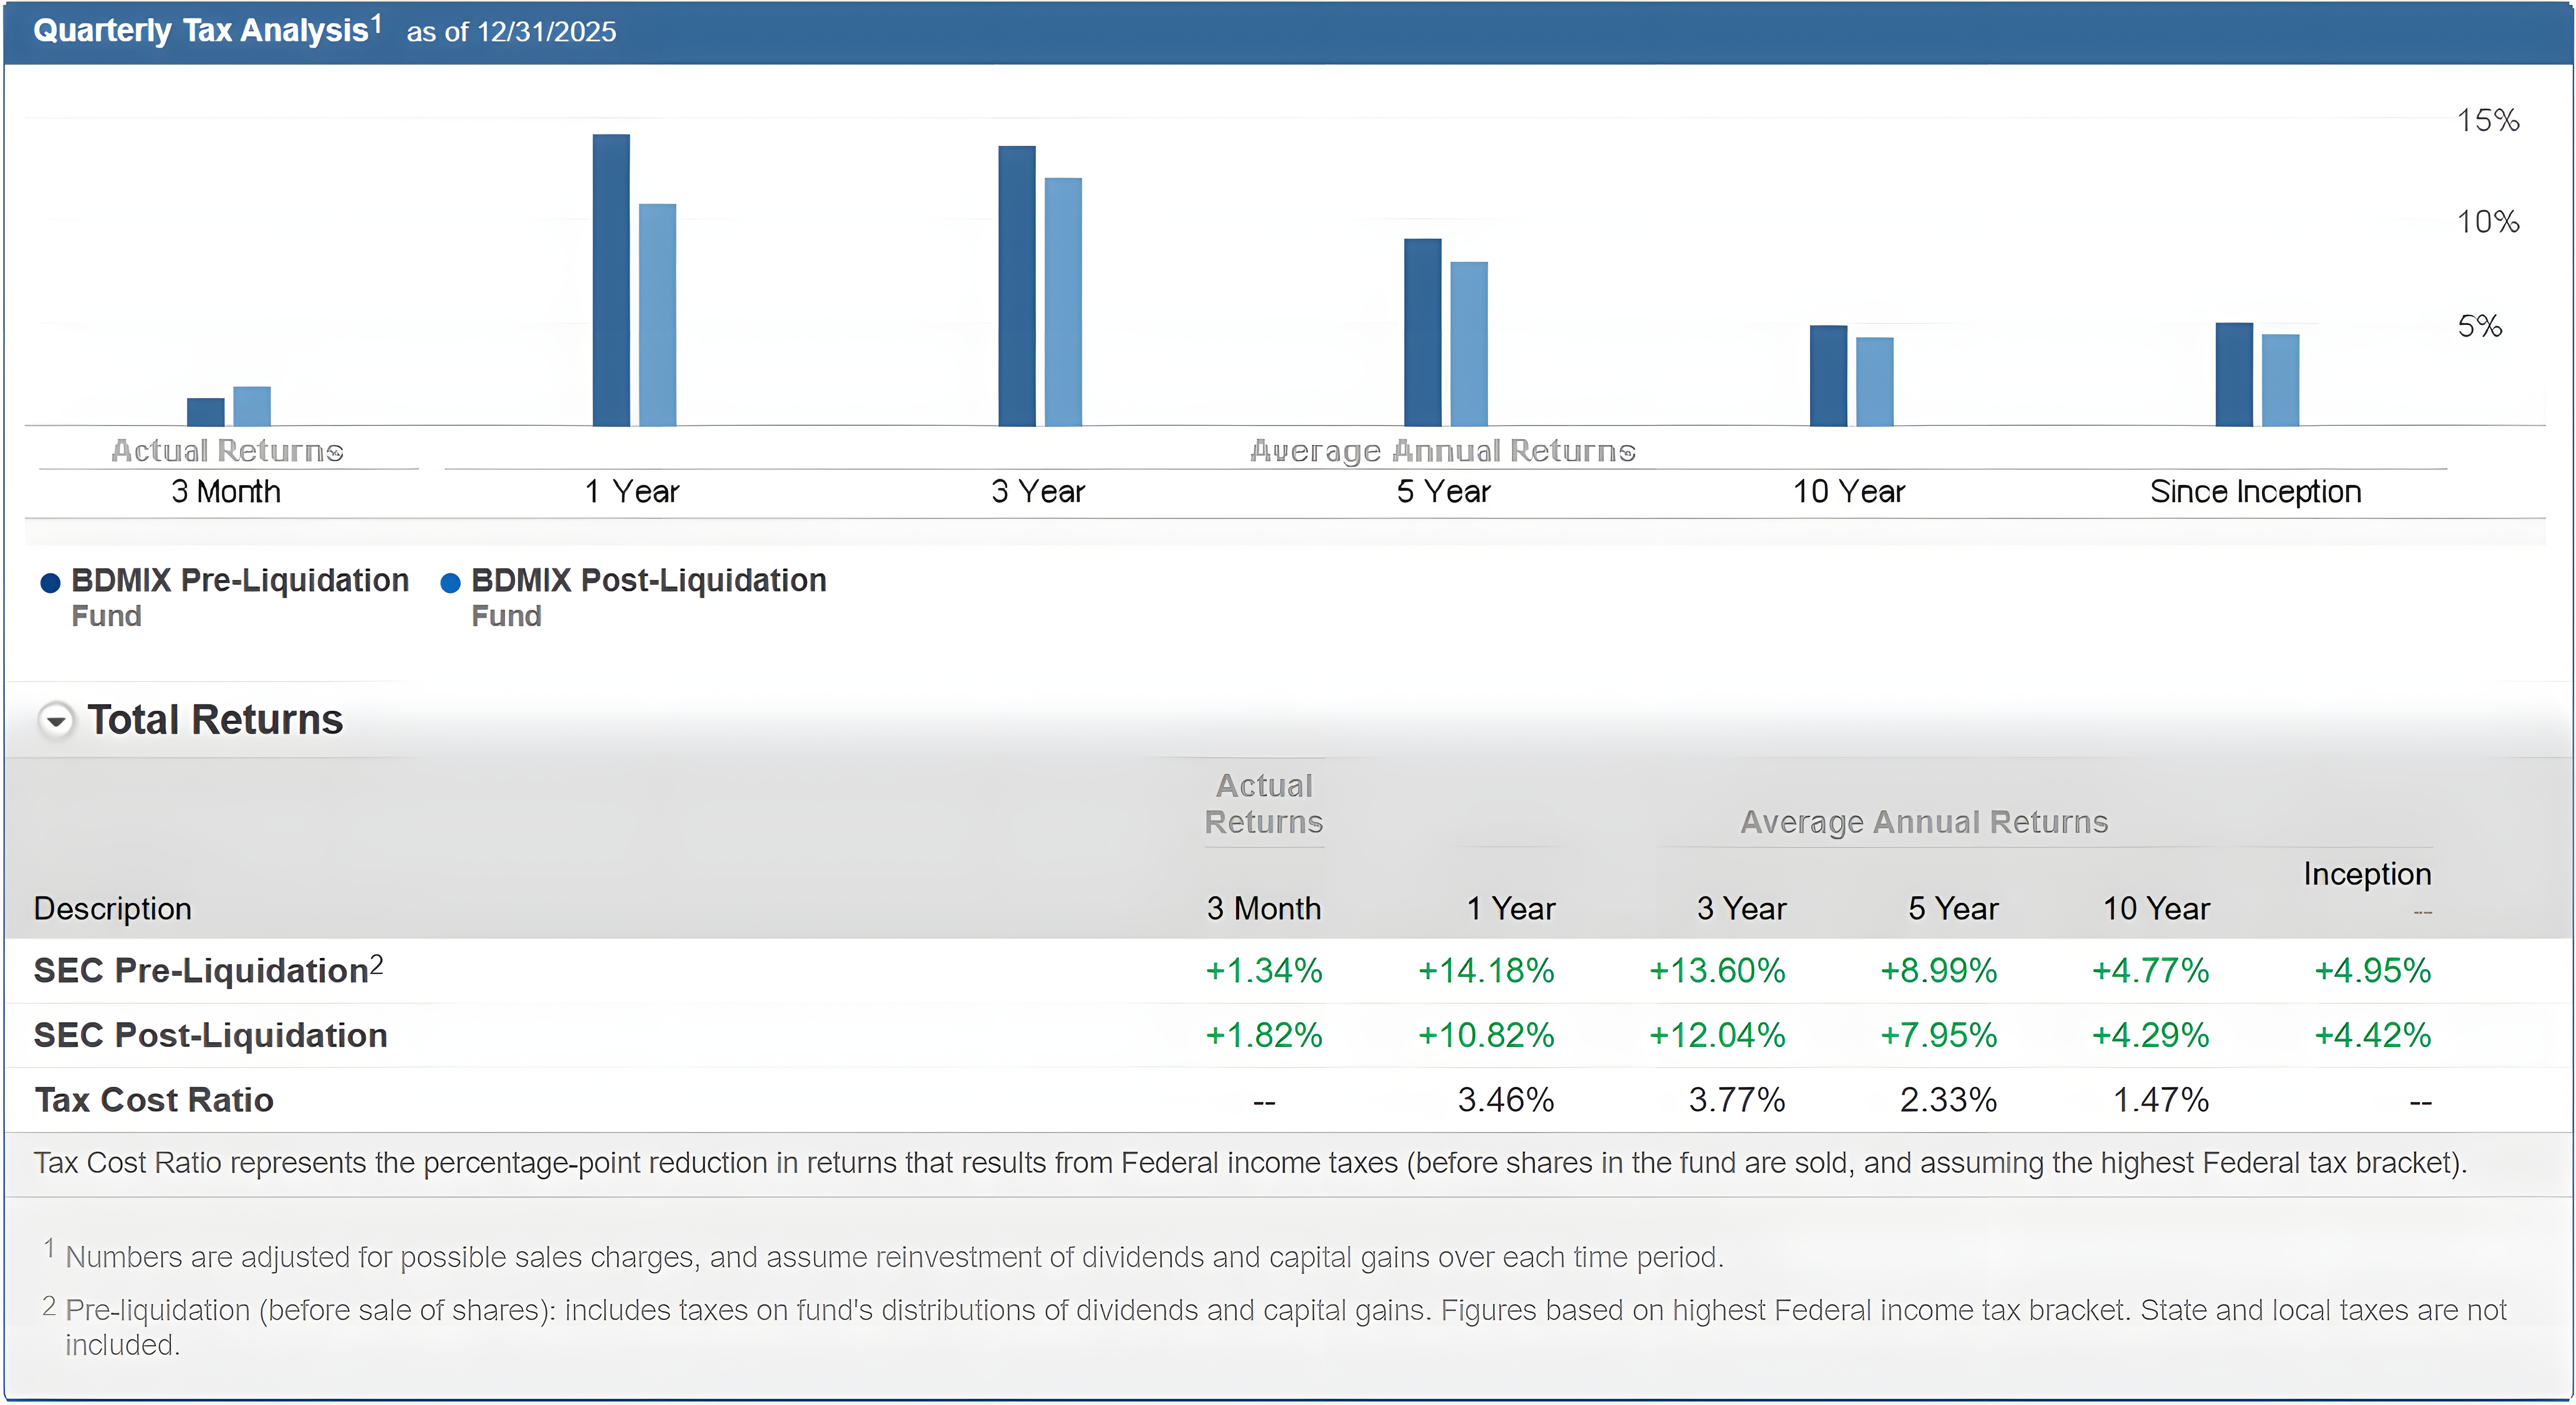
BlackRock Global Equity Mkt Netrl Instl: Gross expense ratio: 1.42%, net expense ratio: 1.34%, expense limitation contractual through 6/30/2026.
BlackRock Systematic Multi-Strat Instl: Gross expense ratio: 0.93%, net expense ratio: 0.93%, expense limitation contractual through 6/30/2027.
BlackRock Tactical Opportunities Instl: Gross expense ratio: 0.77%, net expense ratio: 0.77%, expense limitation contractual through 6/30/2027.
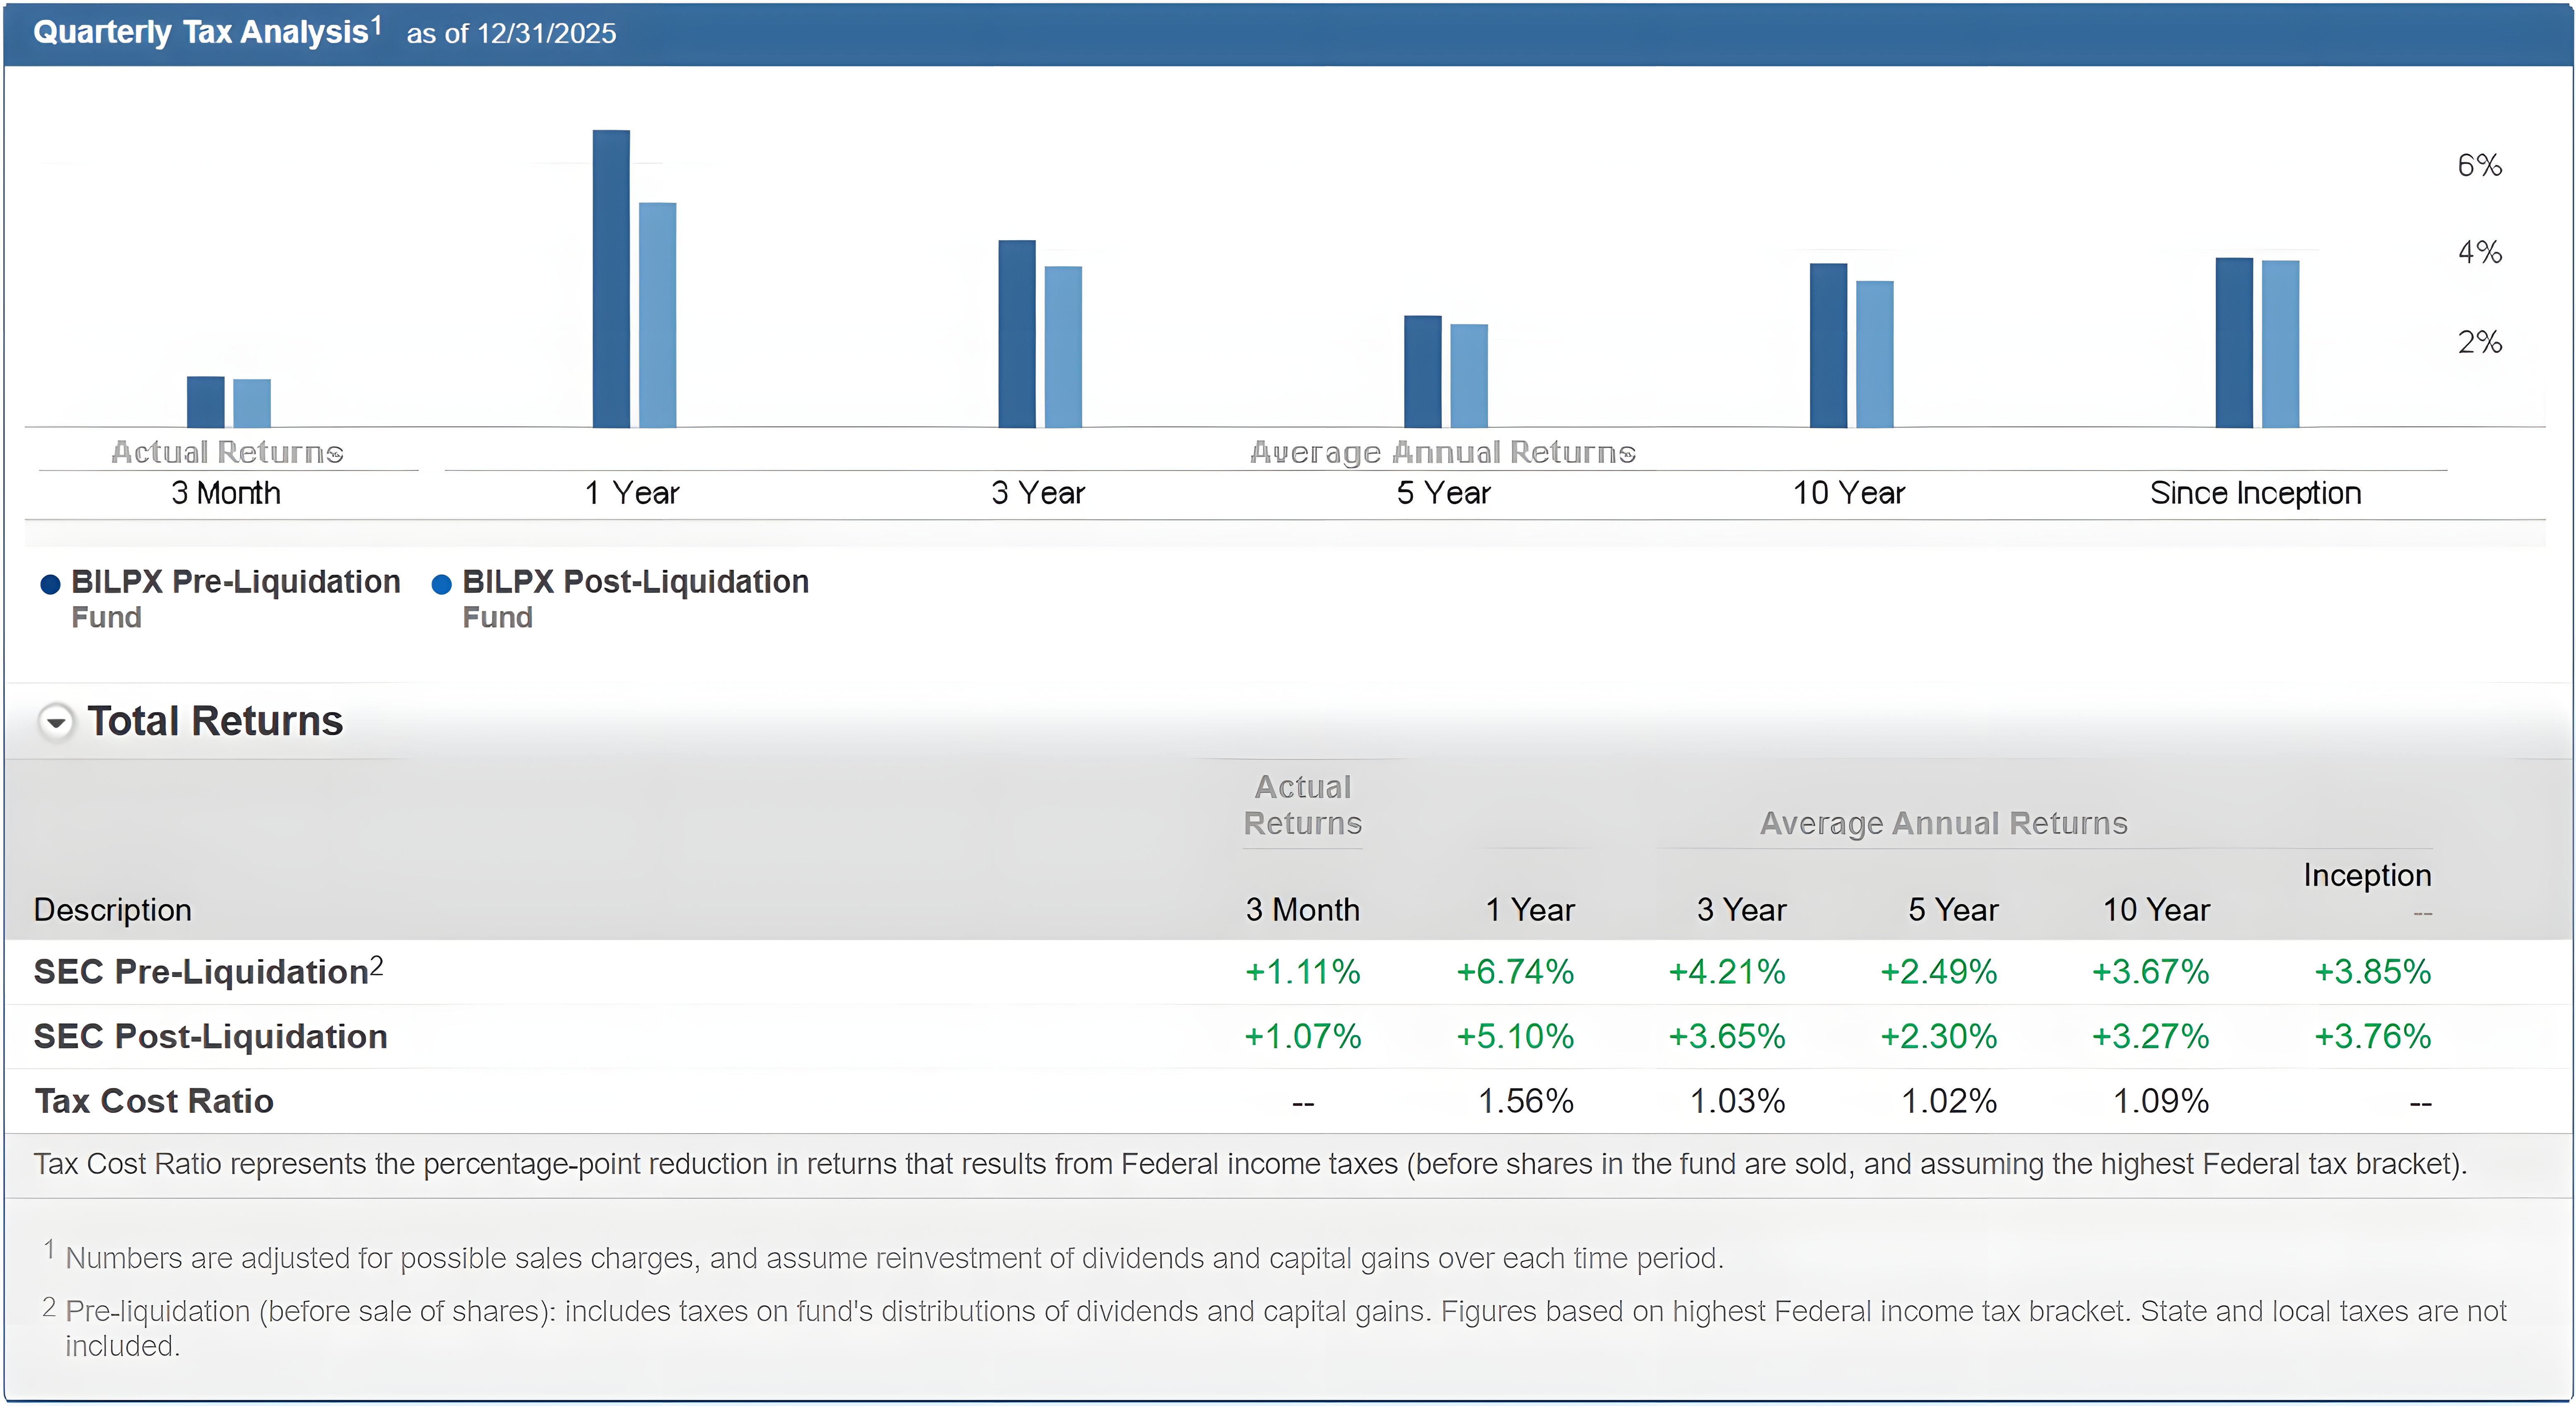
Blackstone Alternative Multi-Strategy I: Gross expense ratio: 3.85%, net expense ratio: 3.77%, expense limitation contractual through 8/31/2027.
Calamos Market Neutral Income I: Gross expense ratio: 0.97%, net expense ratio: 0.97%, no expense limitation agreement.
Campbell Systematic Macro I: Gross expense ratio: 1.84%, net expense ratio: 1.75%, expense limitation contractual through 12/31/2026.
Catalyst/Millburn Hedge Strategy I: Gross expense ratio: 2.00%, net expense ratio: 2.00%, no expense limitation agreement.
Federated Hermes MDT Market Neutral IS: Gross expense ratio: 1.87%, net expense ratio: 1.86%, expense limitation contractual through 3/1/2026.
First Trust Merger Arbitrage Cl I: Gross expense ratio: 1.84%, net expense ratio: 1.84%, no expense limitation agreement.
FS Multi-Strategy Alternatives I: Gross expense ratio: 1.72%, net expense ratio: 1.72%, no expense limitation agreement.
Goldman Sachs Absolute Ret Trckr Instl: Gross expense ratio: 0.83%, net expense ratio: 0.74%, expense limitation contractual through 4/30/2026.
The Merger Fund I: Gross expense ratio: 1.37%, net expense ratio: 1.27%, expense limitation contractual through 4/30/2026.
Victory Market Neutral Income I: Gross expense ratio: 0.58%, net expense ratio: 0.41%, expense limitation contractual through 10/31/2026.
Standpoint is committed to make this website accessible to all audiences, including people with visual, hearing, mobility, and other disabilities. Reasonable efforts will be made to accommodate all users who utilize standard compliant web browsers, as well as enabling software or assistive technology.
If you are having any problems accessing the information found on this website, please contact us for assistance. Please note the nature of your accessibility problem, the format in which you prefer to receive the material, the web page address of the requested material, and the best way to contact you.
Please contact us via email at info@standpointfunds.com or by calling (602) 688-2918.

